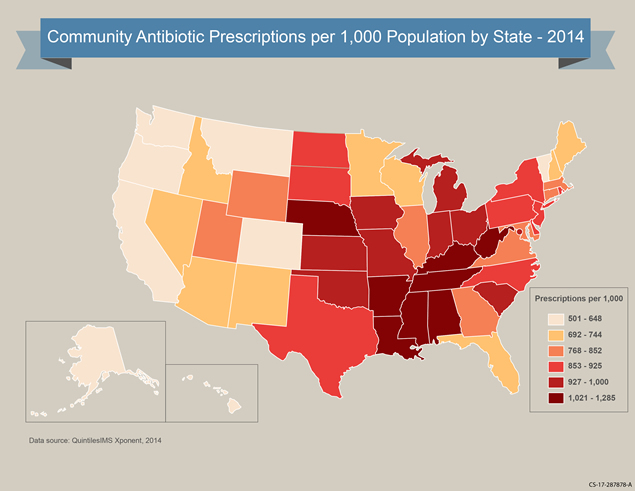
Outpatient Antibiotic Prescriptions — United States, 2014
Healthcare providers prescribed 266.1 million antibiotic prescriptions—equivalent to 835 antibiotic prescriptions per 1000 persons.
Print only version: Outpatient Antibiotic Prescriptions — United States, 2014 [PDF – 338 KB]
Citation: Centers for Disease Control and Prevention. Outpatient antibiotic prescriptions — United States, 2014.
Systemic oral antibiotics were extracted from the IMS Health (now called QuintilesIMS) Xponent database. IMS Health captures >70% of outpatient prescriptions nationally, reconciles them to wholesale deliveries, and projects to 100% coverage. These data represent all outpatient antibiotic prescriptions from community pharmacies and non-governmental mail order pharmacies from all payers, but exclude federal facilities. Provider specialties are taken from the American Medical Association (AMA) self-designated practice specialties and categorized into one of 17 groups. Population data were obtained from the U.S. Census bridging files.
References
- Hicks, L.A., et al., US Outpatient Antibiotic Prescribing Variation According to Geography, Patient Population, and Provider Specialty in 2011. Clin Infect Dis, 2015. 60(9): p. 1308-16.
- IMS. The Uniform System of Classification (USC). [cited2015 September 22]
Table 1. Oral antibiotic prescriptions by age and sex and region—United States, 2014.
| Age groupa | NUMBER OF ANTIBIOTIC PRESCRIPTIONS (MILLIONS) | ANTIBIOTIC PRESCRIPTIONS PER 1,000 PERSONS, RATE |
|---|---|---|
| <20 years | 63.9 | 778 |
| ≥20 years | 198.3 | 838 |
| Sexa | NUMBER OF ANTIBIOTIC PRESCRIPTIONS (MILLIONS) | ANTIBIOTIC PRESCRIPTIONS PER 1,000 PERSONS, RATE |
|---|---|---|
| Female | 161.7 | 999 |
| Male | 103.4 | 659 |
| Regionb | NUMBER OF ANTIBIOTIC PRESCRIPTIONS (MILLIONS) | ANTIBIOTIC PRESCRIPTIONS PER 1,000 PERSONS, RATE |
|---|---|---|
| Northeast | 48.6 | 866 |
| Midwest | 60.8 | 897 |
| South | 110.5 | 923 |
| West | 46.3 | 615 |
a Totals may not add to all oral prescriptions (266.1 million) due to missing data.
b Totals may not add to all oral prescriptions (266.1 million) due to rounding.
Table 2. Top oral antibiotic classes and agents prescribed—United States, 2014.
| ANTIBIOTIC CLASS | NUMBER OF ANTIBIOTIC PRESCRIPTIONS (MILLIONS) | ANTIBIOTIC PRESCRIPTIONS (MILLIONS) PER 1,000 PERSONS, RATE |
|---|---|---|
| Penicillins | 60.7 | 191 |
| Macrolides | 49.0 | 154 |
| Cephalosporins | 35.7 | 112 |
| Fluoroquinolones | 32.8 | 103 |
| Beta-lactams, increased activity | 23.5 | 74 |
| ANTIBIOTIC AGENT | NUMBER OF ANTIBIOTIC PRESCRIPTIONS (MILLIONS) | ANTIBIOTIC PRESCRIPTIONS (MILLIONS) PER 1,000 PERSONS, RATE |
|---|---|---|
| Amoxicillin | 53.6 | 168 |
| Azithromycin | 45.7 | 143 |
| Amoxicillin/clavulanic acid | 23.5 | 74 |
| Cephalexin | 21.3 | 67 |
| Ciprofloxacin | 20.8 | 65 |
Table 3. Oral antibiotic prescribing by provider specialty — United States, 2014.
| PROVIDER SPECIALTY | NUMBER OF ANTIBIOTIC PRESCRIPTIONS (MILLIONS) | ANTIBIOTIC PRESCRIPTIONS PER PROVIDER, RATE |
|---|---|---|
| Primary Care Physicians | 114.7 | 483 |
| Physician Assistants and Nurse Practitioners | 54.4 | 314 |
| Dentistry | 24.9 | 203 |
| Surgical Specialties | 19.9 | 223 |
| Emergency Medicine | 14.2 | 440 |
| Dermatology | 7.6 | 669 |
| Obstetrics/Gynecology | 6.6 | 175 |
| Other | 23.8 | 114 |
| All Providers | 266.1 | 292 |
| State | Number of prescriptions per 1000 persons, Rate |
|---|---|
| Alabama | 1,123 |
| Alaska | 501 |
| Arizona | 740 |
| Arkansas | 1,155 |
| California | 570 |
| Colorado | 624 |
| Connecticut | 847 |
| Delaware | 938 |
| District Of Columbia | 1,021 |
| Florida | 728 |
| Georgia | 840 |
| Hawaii | 643 |
| Idaho | 692 |
| Illinois | 852 |
| Indiana | 950 |
| Iowa | 1,000 |
| Kansas | 992 |
| Kentucky | 1,262 |
| Louisiana | 1,177 |
| Maine | 720 |
| Maryland | 796 |
| Massachusetts | 768 |
| Michigan | 925 |
| Minnesota | 710 |
| Mississippi | 1,222 |
| Missouri | 936 |
| Montana | 648 |
| Nebraska | 1,045 |
| Nevada | 709 |
| New Hampshire | 701 |
| New Jersey | 902 |
| New Mexico | 714 |
| New York | 899 |
| North Carolina | 861 |
| North Dakota | 853 |
| Ohio | 964 |
| Oklahoma | 965 |
| Oregon | 570 |
| Pennsylvania | 885 |
| Rhode Island | 892 |
| South Carolina | 927 |
| South Dakota | 901 |
| Tennessee | 1,162 |
| Texas | 899 |
| Utah | 783 |
| Vermont | 638 |
| Virginia | 799 |
| Washington | 600 |
| West Virginia | 1,285 |
| Wisconsin | 744 |
| Wyoming | 777 |
