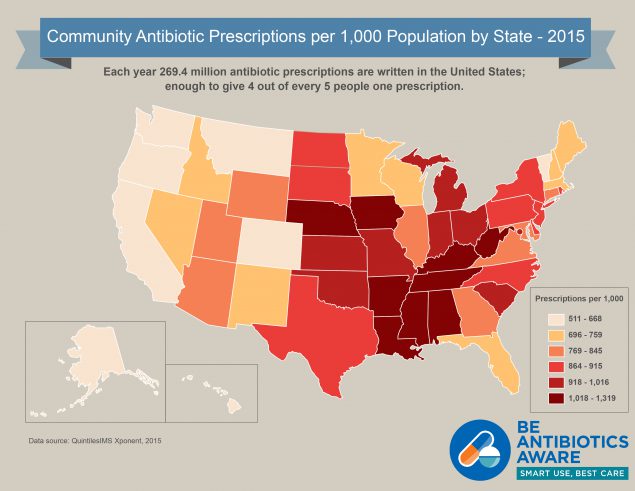
Outpatient Antibiotic Prescriptions — United States, 2015
Healthcare providers prescribed 269.4 million antibiotic prescriptions—equivalent to 838 antibiotic prescriptions per 1000 persons.
Print only version: Outpatient Antibiotic Prescriptions — United States, 2015 [PDF – 366 KB]
Citation: Centers for Disease Control and Prevention. Outpatient antibiotic prescriptions — United States, 2015.
Systemic oral antibiotics were extracted from the QuintilesIMS Xponent database. QuintilesIMS captured an estimated 88% of outpatient prescriptions for any medication nationally, reconciled them to wholesale deliveries, and projected to 100% coverage. These data represent all outpatient antibiotic prescriptions from community pharmacies from all payers, but exclude federal facilities. Provider specialties are taken from the American Medical Association (AMA) self-designated practice specialties and categorized into one of 17 groups. Population data were obtained from the U.S. Census bridging files.
References
Hicks, L.A., et al., US Outpatient Antibiotic Prescribing Variation According to Geography, Patient Population, and Provider Specialty in 2011. Clin Infect Dis, 2015. 60(9): p. 1308-16.
Table 1. Oral antibiotic prescriptions by age, sex and region—United States, 2015
| Age group | NUMBER OF ANTIBIOTIC PRESCRIPTIONS (MILLIONS) | ANTIBIOTIC PRESCRIPTIONS PER 1,000 PERSONS, RATE |
|---|---|---|
| <20 yearsa | 64.7 | 778 |
| ≥20 yearsa | 203.3 | 850 |
| Sex | NUMBER OF ANTIBIOTIC PRESCRIPTIONS (MILLIONS) | ANTIBIOTIC PRESCRIPTIONS PER 1,000 PERSONS, RATE |
|---|---|---|
| Femalea | 164.0 | 1,005 |
| Malea | 104.9 | 663 |
| Region | NUMBER OF ANTIBIOTIC PRESCRIPTIONS (MILLIONS) | ANTIBIOTIC PRESCRIPTIONS PER 1,000 PERSONS, RATE |
|---|---|---|
| Northeastb | 48.8 | 867 |
| Midwestb | 61.0 | 898 |
| Southb | 111.5 | 920 |
| Westb | 48.1 | 632 |
aTotals may not add to all oral prescriptions (269.4 million) due to missing data
bTotals may not add to all oral prescriptions (269.4 million) due to rounding.
Table 2. Top oral antibiotic classes and agents prescribed—United States, 2015
| ANTIBIOTIC CLASS | NUMBER OF ANTIBIOTIC PRESCRIPTIONS (MILLIONS) | ANTIBIOTIC PRESCRIPTIONS PER 1,000 PERSONS, RATE |
|---|---|---|
| Penicillins | 61.6 | 192 |
| Macrolides | 49.4 | 154 |
| Cephalosporins | 36.3 | 113 |
| Fluoroquinolones | 32.5 | 101 |
| Beta-lactams, increased activity | 25.3 | 79 |
| ANTIBIOTIC AGENT | NUMBER OF ANTIBIOTIC PRESCRIPTIONS (MILLIONS) | ANTIBIOTIC PRESCRIPTIONS PER 1,000 PERSONS, RATE |
|---|---|---|
| Amoxicillin | 54.8 | 171 |
| Azithromycin | 46.2 | 144 |
| Amoxicillin/clavulanic acid | 25.3 | 79 |
| Cephalexin | 21.4 | 67 |
| Ciprofloxacin | 20.3 | 63 |
Table 3. Oral antibiotic prescribing by provider specialty — United States, 2015
| PROVIDER SPECIALTY | NUMBER OF ANTIBIOTIC PRESCRIPTIONS (MILLIONS) | ANTIBIOTIC PRESCRIPTIONS PER PROVIDER, RATE |
|---|---|---|
| Primary Care Physicians | 110.8 | 466 |
| Physician Assistants and Nurse Practitioners | 62.9 | 363 |
| Surgical Specialties | 19.5 | 219 |
| Dentistry | 25.1 | 205 |
| Emergency Medicine | 14.8 | 457 |
| Dermatology | 7.1 | 628 |
| Obstetrics/Gynecology | 6.3 | 167 |
| Other | 22.9 | 110 |
| All Providers | 269.4 | 295 |
| State | Number of prescriptions per 1000 persons, Rate |
|---|---|
| Alabama | 1,149 |
| Alaska | 511 |
| Arizona | 769 |
| Arkansas | 1,154 |
| California | 590 |
| Colorado | 624 |
| Connecticut | 843 |
| Delaware | 915 |
| District Of Columbia | 979 |
| Florida | 706 |
| Georgia | 830 |
| Hawaii | 640 |
| Idaho | 720 |
| Illinois | 845 |
| Indiana | 964 |
| Iowa | 1,018 |
| Kansas | 1,016 |
| Kentucky | 1,256 |
| Louisiana | 1,174 |
| Maine | 732 |
| Maryland | 794 |
| Massachusetts | 759 |
| Michigan | 918 |
| Minnesota | 696 |
| Mississippi | 1,254 |
| Missouri | 944 |
| Montana | 662 |
| Nebraska | 1,072 |
| Nevada | 733 |
| New Hampshire | 728 |
| New Jersey | 903 |
| New Mexico | 724 |
| New York | 898 |
| North Carolina | 872 |
| North Dakota | 864 |
| Ohio | 964 |
| Oklahoma | 966 |
| Oregon | 582 |
| Pennsylvania | 895 |
| Rhode Island | 888 |
| South Carolina | 936 |
| South Dakota | 893 |
| Tennessee | 1,165 |
| Texas | 895 |
| Utah | 779 |
| Vermont | 668 |
| Virginia | 804 |
| Washington | 610 |
| West Virginia | 1,319 |
| Wisconsin | 745 |
| Wyoming | 789 |
