Outpatient Antibiotic Prescriptions — United States, 2018
Print only version: Outpatient Antibiotic Prescriptions — United States, 2018 [PDF – 5 pages]
Citation: Centers for Disease Control and Prevention. Outpatient antibiotic prescriptions — United States, 2018.
Systemic oral antibiotics were extracted from the IQVIA Xponent database. IQVIA captured an estimated 92% of retail outpatient prescriptions for any medication nationally, reconciled them to wholesale deliveries to these pharmacies, and projected to 100% coverage. These data represent all outpatient antibiotic prescriptions from community pharmacies from all payers but exclude federal facilities. Provider specialties are taken from the American Medical Association (AMA) self-designated practice specialties, DEA and NPI sources and categorized into one of 17 groups. Population data were obtained from the U.S. Census bridging files. Starting in 2017, enhancements to IQVIA’s methodology also take into account that some prescriptions which are ordered may not be picked up by the patient and that patients may not pay for their prescriptions in the way that the pharmacy expects, leading to prescriptions that are ultimately not dispensed. Previous methodology did not account for the return or restocking of these prescriptions filled, but not picked up by patients. Accounting for these situations, which can lead to overstated prescriptions, likely makes the revised methodology data more accurate. However, for comparisons to previous years of estimates the previous methodology data should be used.
Total outpatient oral antibiotic prescriptions in 2018
Previous methodology: 258.9 million total oral antibiotic prescriptions, equivalent to 791 prescriptions per 1000 persons
Revised methodology: 249.8 million total antibiotic prescriptions, equivalent to 763 prescriptions per 1000 persons
Age groupc
| Characteristics | NUMBER OF ANTIBIOTIC PRESCRIPTIONS (MILLIONS) | ANTIBIOTIC PRESCRIPTIONS PER 1,000 PERSONS, RATE | NUMBER OF ANTIBIOTIC PRESCRIPTIONS (MILLIONS) | ANTIBIOTIC PRESCRIPTIONS PER 1,000 PERSONS, RATE |
|---|---|---|---|---|
| Previous methodologya | Revised methodologyb | |||
| <20 years | 58.2 | 710 | 56.2 | 686 |
| ≥20 years | 200.7 | 818 | 193.2 | 788 |
Sexc
| Characteristics | NUMBER OF ANTIBIOTIC PRESCRIPTIONS (MILLIONS) | ANTIBIOTIC PRESCRIPTIONS PER 1,000 PERSONS, RATE | NUMBER OF ANTIBIOTIC PRESCRIPTIONS (MILLIONS) | ANTIBIOTIC PRESCRIPTIONS PER 1,000 PERSONS, RATE |
|---|---|---|---|---|
| Previous methodologya | Revised methodologyb | |||
| Female | 157.9 | 951 | 152.1 | 916 |
| Male | 100.9 | 626 | 97.4 | 604 |
Regiond
| Characteristics | NUMBER OF ANTIBIOTIC PRESCRIPTIONS (MILLIONS) | ANTIBIOTIC PRESCRIPTIONS PER 1,000 PERSONS, RATE | NUMBER OF ANTIBIOTIC PRESCRIPTIONS (MILLIONS) | ANTIBIOTIC PRESCRIPTIONS PER 1,000 PERSONS, RATE |
|---|---|---|---|---|
| Previous methodologya | Revised methodologyb | |||
| Midwest | 55.8 | 817 | 53.8 | 788 |
| Northeast | 47.1 | 839 | 45.3 | 808 |
| South | 111.6 | 895 | 107.7 | 863 |
| West | 44.4 | 569 | 42.9 | 550 |
aEstimates created using previous IQVIA methodology
bEstimates created using data from revised methodology accounting for reversed and voided prescriptions across weeks
cTotals may not add to all oral prescriptions due to missing data
dTotals may not add to all oral prescriptions due to rounding
Antibiotic class
| Characteristics | NUMBER OF ANTIBIOTIC PRESCRIPTIONS (MILLIONS) | ANTIBIOTIC PRESCRIPTIONS PER 1,000 PERSONS, RATE | NUMBER OF ANTIBIOTIC PRESCRIPTIONS (MILLIONS) | ANTIBIOTIC PRESCRIPTIONS PER 1,000 PERSONS, RATE |
|---|---|---|---|---|
| Previous methodologya | Revised methodologyb | |||
| Penicillins | 60.6 | 185 | 59 | 180 |
| Macrolides | 41.9 | 128 | 40.5 | 124 |
| Cephalosporins | 37.2 | 114 | 35.9 | 110 |
| Beta-lactams, Increased activity | 27.5 | 84 | 26.6 | 81 |
| Tetracyclines | 24.3 | 74 | 23 | 70 |
Antibiotic agent
| Characteristics | NUMBER OF ANTIBIOTIC PRESCRIPTIONS (MILLIONS) | ANTIBIOTIC PRESCRIPTIONS PER 1,000 PERSONS, RATE | NUMBER OF ANTIBIOTIC PRESCRIPTIONS (MILLIONS) | ANTIBIOTIC PRESCRIPTIONS PER 1,000 PERSONS, RATE |
|---|---|---|---|---|
| Previous methodologya | Revised methodologyb | |||
| Amoxicillin | 55.3 | 169 | 53.8 | 164 |
| Azithromycin | 39.7 | 121 | 38.5 | 118 |
| Amoxicillin/clavulanic acid | 27.5 | 84 | 26.6 | 81 |
| Cephalexin | 22.2 | 68 | 21.4 | 65 |
| Doxycycline | 20.2 | 62 | 19.2 | 59 |
a. Estimates created using previous IQVIA methodology
b. Estimates created using data from revised methodology accounting for reversed and voided prescriptions across weeks
| Provider Specialty | NUMBER OF ANTIBIOTIC PRESCRIPTIONS (MILLIONS) | ANTIBIOTIC PRESCRIPTIONS PER PROVIDER, RATE | NUMBER OF ANTIBIOTIC PRESCRIPTIONS (MILLIONS) | ANTIBIOTIC PRESCRIPTIONS PER PROVIDER, RATE |
|---|---|---|---|---|
| Previous methodologya | Revised methodologyb | |||
| Primary Care Physicians | 92.5 | 389 | 89.3 | 376 |
| Physician Assistants and Nurse Practitioners | 76.5 | 442 | 73.3 | 423 |
| Surgical Specialties | 18.2 | 204 | 17.5 | 196 |
| Dentistry | 25.4 | 207 | 24.7 | 201 |
| Emergency Medicine | 13.1 | 404 | 12.7 | 392 |
| Dermatology | 6.3 | 555 | 5.9 | 525 |
| Obstetrics/Gynecology | 5.4 | 145 | 5.1 | 137 |
| Other | 21.5 | 103 | 21.2 | 102 |
| All Providers | 258.9 | 284 | 249.8 | 274 |
a. Estimates created using previous IQVIA methodology
b. Estimates created using data from revised methodology accounting for reversed and voided prescriptions across weeks
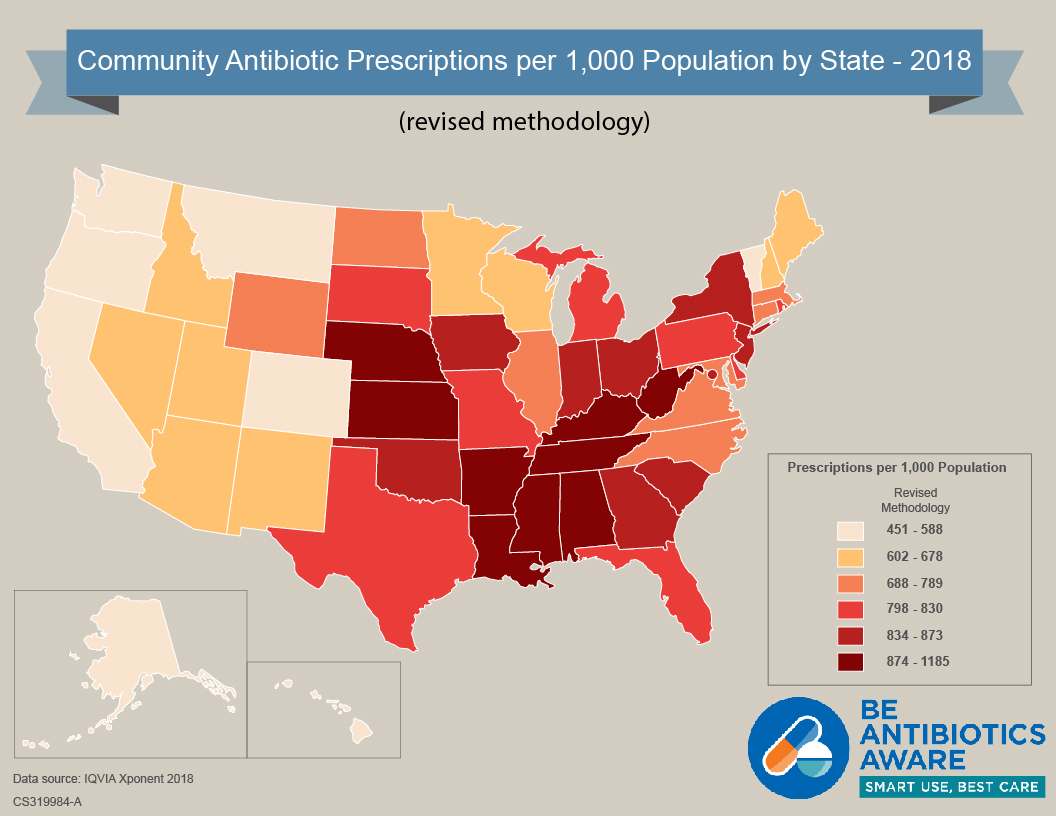
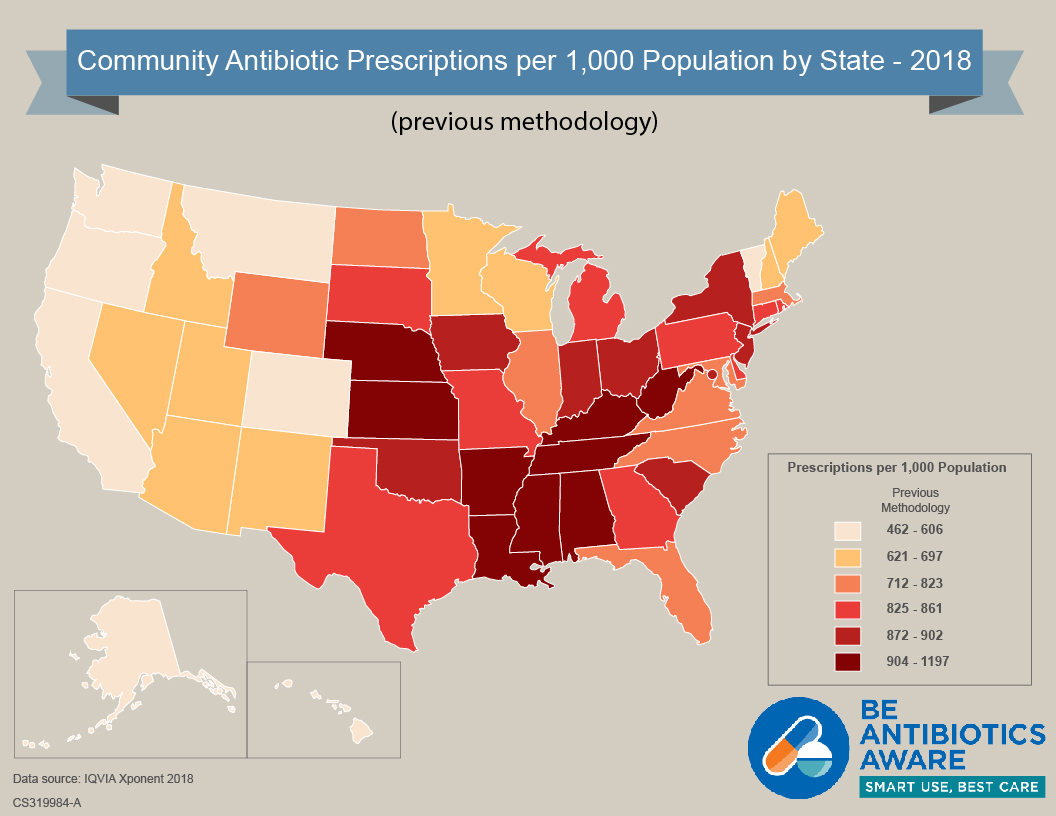
Figure 2. Antibiotic prescriptions per 1,000 persons by state (sextiles) for all ages— United States, 2018, estimates created using revised methodology accounting for reversed and voided prescriptions across weeks

This project was made possible through a partnership with the CDC Foundation. Support for this project was provided by The Pew Charitable Trusts.
| State | Antibiotic prescriptions per 1,000 persons, Rate | |
|---|---|---|
| Previous methodologya | Revised methodologyb | |
| West Virginia | 1197 | 1185 |
| Kentucky | 1174 | 1127 |
| Mississippi | 1170 | 1117 |
| Louisiana | 1169 | 1122 |
| Alabama | 1158 | 1116 |
| Tennessee | 1184 | 1037 |
| Arkansas | 1051 | 1011 |
| Nebraska | 973 | 935 |
| Iowa | 902 | 873 |
| Ohio | 901 | 869 |
| Indiana | 875 | 844 |
| Kansas | 904 | 874 |
| South Carolina | 900 | 868 |
| District of Columbia | 872 | 830 |
| New York | 891 | 857 |
| Oklahoma | 888 | 849 |
| New Jersey | 874 | 844 |
| Missouri | 835 | 806 |
| Delaware | 853 | 805 |
| Michigan | 841 | 814 |
| Pennsylvania | 841 | 811 |
| Rhode Island | 859 | 824 |
| Georgia | 861 | 834 |
| South Dakota | 830 | 811 |
| Texas | 831 | 803 |
| North Carolina | 799 | 775 |
| Connecticut | 825 | 789 |
| Florida | 823 | 798 |
| Illinois | 785 | 750 |
| Virginia | 745 | 718 |
| Wyoming | 778 | 753 |
| North Dakota | 712 | 688 |
| Maryland | 746 | 718 |
| Massachusetts | 725 | 696 |
| Arizona | 697 | 669 |
| Utah | 686 | 665 |
| New Hampshire | 694 | 678 |
| Nevada | 682 | 653 |
| Wisconsin | 656 | 632 |
| Maine | 673 | 650 |
| New Mexico | 672 | 637 |
| Idaho | 648 | 634 |
| Minnesota | 621 | 602 |
| Vermont | 606 | 588 |
| Montana | 593 | 584 |
| Hawaii | 598 | 577 |
| California | 537 | 518 |
| Colorado | 531 | 515 |
| Washington | 531 | 519 |
| Oregon | 495 | 490 |
| Alaska | 462 | 451 |
a. Estimates created using previous IQVIA methodology
b. Estimates created using data from revised methodology accounting for reversed and voided prescriptions across weeks
