Outpatient Antibiotic Prescriptions — United States, 2019
Print Version: Outpatient Antibiotic Prescriptions — United States, 2019 [PDF – 4 Pages]
Citation: Centers for Disease Control and Prevention. Outpatient antibiotic prescriptions — United States, 2019.
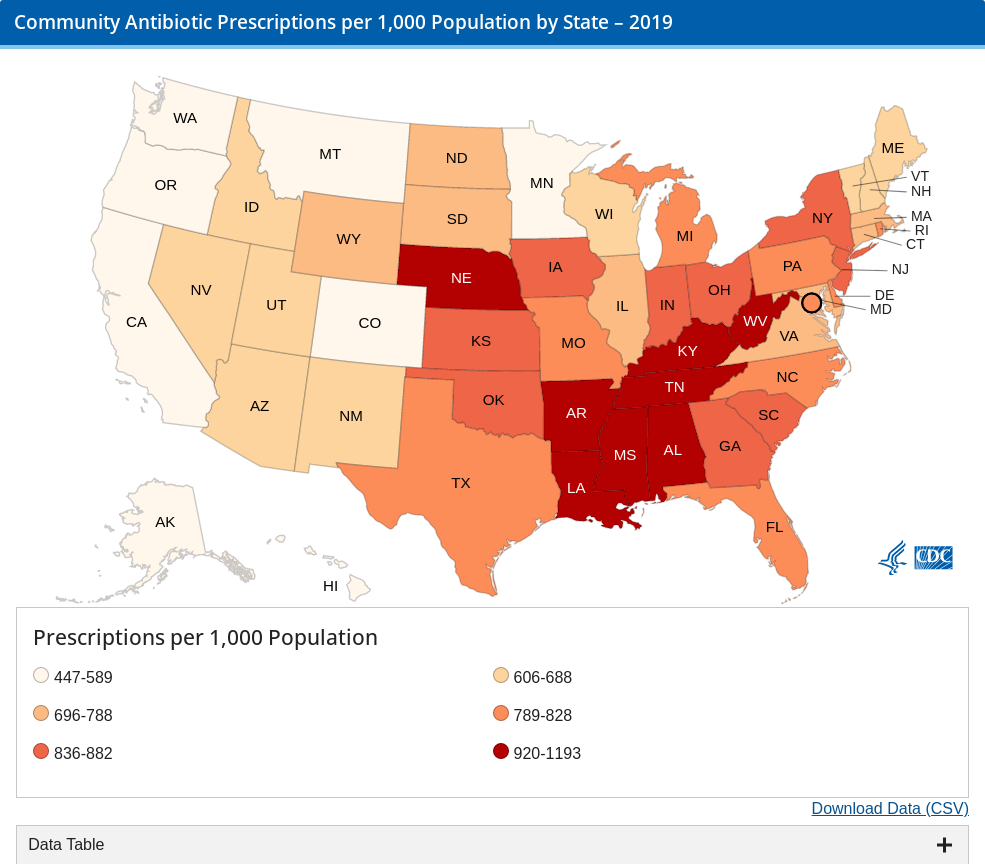
Systemic oral antibiotics were extracted from the IQVIA Xponent database. IQVIA captured an estimated 92% of outpatient prescriptions dispensed* from retail pharmacies for any medication nationally, reconciled them to wholesale deliveries to these pharmacies, and projected to 100% coverage. These data represent all outpatient antibiotic prescriptions from community pharmacies from all payers but exclude federal facilities. Provider specialties are taken from the American Medical Association (AMA) self-designated practice specialties, DEA and NPI sources and categorized into one of 17 groups. Population data were obtained from the U.S. Census bridging files.
*Note: In 2017, IQVIA revised and enhanced their methodology to account for prescriptions not picked up, returned, or re-stocked. These situations may have led to overstated prescriptions and makes the revised methodology data more accurate. Previous methodology data should not be directly compared to revised methodology. Data using both revised and previous methodology data are available in the 2017 and 2018 Annual Reports, however only revised data is available for 2019 onward.
| Age groupa | NUMBER OF ANTIBIOTIC PRESCRIPTIONS (MILLIONS) | ANTIBIOTIC PRESCRIPTIONS PER 1,000 PERSONS, RATE |
|---|---|---|
| <20 | 55.8 | 650 |
| >=20 | 194.8 | 804 |
| Sexa | NUMBER OF ANTIBIOTIC PRESCRIPTIONS (MILLIONS) | ANTIBIOTIC PRESCRIPTIONS PER 1,000 PERSONS, RATE |
|---|---|---|
| Male | 97.9 | 606 |
| Female | 152.8 | 917 |
| Regiona | NUMBER OF ANTIBIOTIC PRESCRIPTIONS (MILLIONS) | ANTIBIOTIC PRESCRIPTIONS PER 1,000 PERSONS, RATE |
|---|---|---|
| Northeast | 45.1 | 806 |
| Midwest | 53.8 | 788 |
| South | 108.9 | 867 |
| West | 43 | 549 |
aTotals may not add to all oral prescriptions (251.1 million) due to missing data
| ANTIBIOTIC CLASS | NUMBER OF ANTIBIOTIC PRESCRIPTIONS (MILLIONS) | ANTIBIOTIC PRESCRIPTIONS PER 1,000 PERSONS, RATE |
|---|---|---|
| Penicillins | 58.8 | 179 |
| Macrolides | 39.8 | 121 |
| Cephalosporins | 37.1 | 113 |
| B-lactams, increased activity | 28.4 | 87 |
| Tetracycline | 24.9 | 76 |
| ANTIBIOTIC AGENT | NUMBER OF ANTIBIOTIC PRESCRIPTIONS (MILLIONS) | ANTIBIOTIC PRESCRIPTIONS PER 1,000 PERSONS, RATE |
|---|---|---|
| Amoxicillin | 54.1 | 165 |
| Azithromycin | 37.9 | 115 |
| Amoxicillin\clavulanic acid | 28.4 | 87 |
| Cephalexin | 21.7 | 66 |
| Doxycycline | 21.3 | 65 |
| Provider Specialty | NUMBER OF ANTIBIOTIC PRESCRIPTIONS (MILLIONS) | ANTIBIOTIC PRESCRIPTIONS PER PROVIDER, RATE |
|---|---|---|
| Primary Care Physicians | 85.9 | 362 |
| Physician Assistants and Nurse Practitioners | 80.8 | 466 |
| Surgical Specialties | 17.2 | 192 |
| Dentistry | 24.7 | 201 |
| Emergency Medicine | 12.5 | 386 |
| Dermatology | 5.8 | 514 |
| Obstetrics/Gynecology | 4.9 | 130 |
| Other | 19.2 | 92 |
| All Providers | 251.0 | 275 |
aTotals may not add to all oral prescriptions (251.1 million) due to missing data
