Recommendations for Fully Vaccinated People
COVID-19 Homepage

COVIDView Summary ending on March 28, 2020
COVIDView: A Weekly Surveillance Summary of U.S. COVID-19 Activity
This CDC report provides a weekly summary and interpretation of key indicators being adapted to track the COVID-19 pandemic in the United States. This includes information related to COVID-19 outpatient visits, emergency department visits, hospitalizations and deaths, as well as laboratory data.
Virus
Public Health, Commercial and Clinical Laboratories
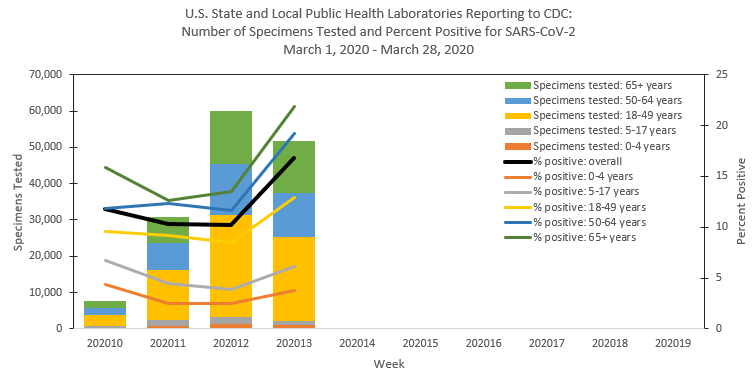
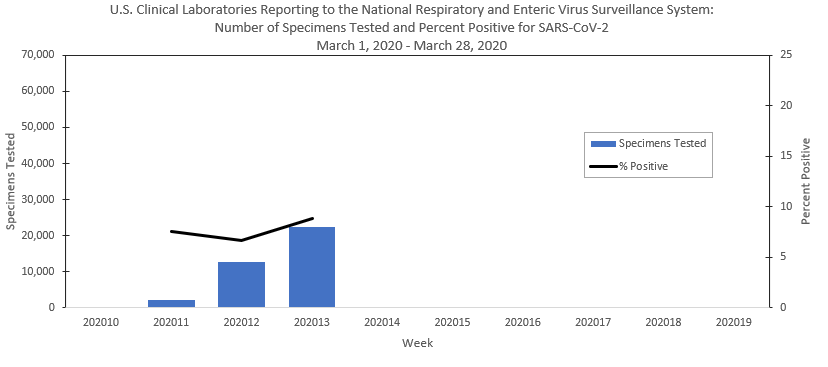
Public health, commercial and clinical laboratories are all conducting testing and reporting testing results for COVID-19. The national percentage of respiratory specimens testing positive for SARS-CoV-2 is increasing and is now:
- 16.5% at public health laboratories and,
- 8.8% at clinical laboratories.
Data from commercial laboratories will be incorporated into this report in the coming weeks.
Outpatient and Emergency Department Visits
Outpatient Influenza-Like Illness Network (ILINet) and National Syndromic Surveillance Program (NSSP)
Two indicators from existing surveillance systems are being monitored to track outpatient or emergency department (ED) visits for potential COVID-19 illness.
- Nationally, the percentage of visits for influenza-like illness (ILI) and COVID-19-like illness (CLI) is elevated compared to what is normally seen at this time.
Recent changes in health care seeking behavior are likely impacting both networks, making it difficult to draw further conclusions at this time. Tracking these systems moving forward will give additional insight into illness related to COVID-19.
Severe Disease
Hospitalizations
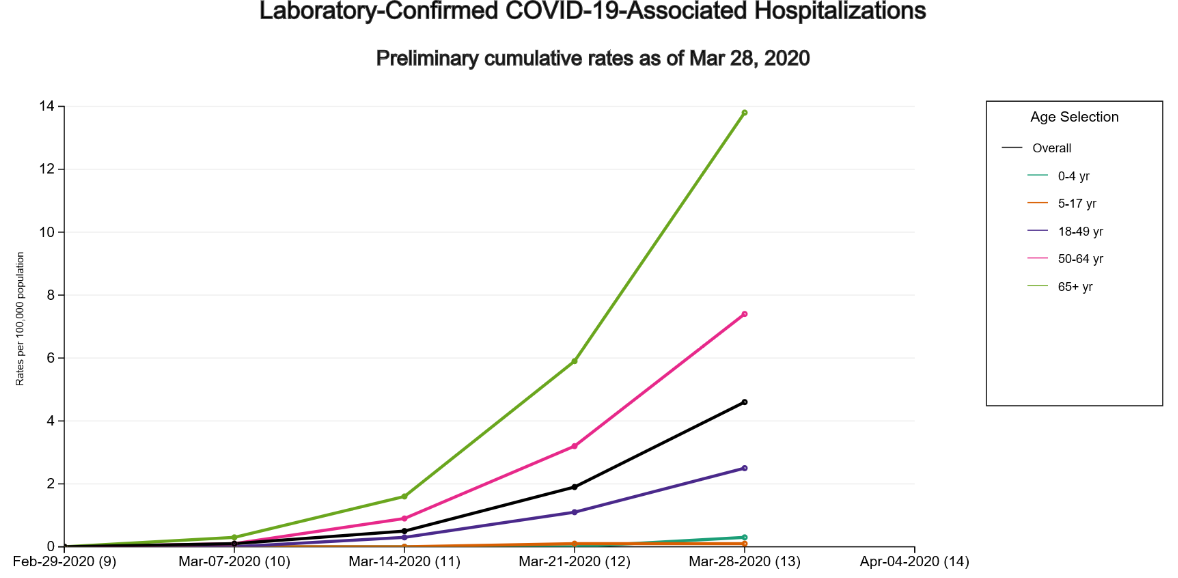
Cumulative COVID-19-associated hospitalization rates since March 1, 2020, will be updated weekly. The overall cumulative hospitalization rate is 4.6 per 100,000, with the highest rates in persons 65 years and older (13.8 per 100,000) and 50-64 years (7.4 per 100,000).
Mortality
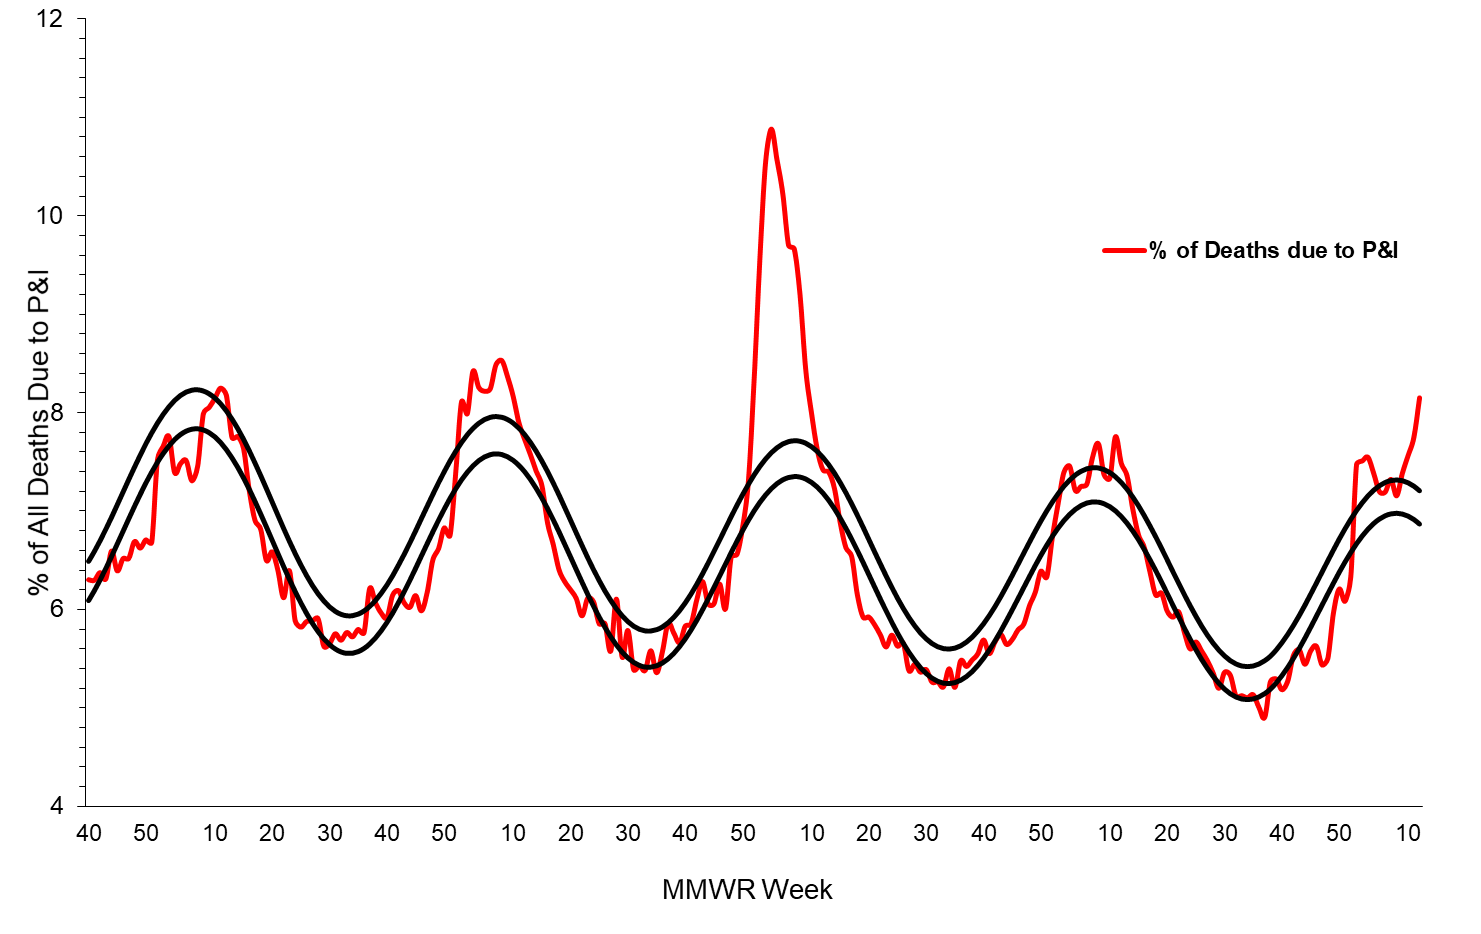
The percentage of deaths attributed to pneumonia and influenza is 8.2% which is above the epidemic threshold of 7.2%. Deaths due to pneumonia have increased sharply since the end of February, while those due to influenza increased modestly through early March and declined this week. Deaths attributed specifically to COVID-19 will be reported next week.
Key Points
- CDC is modifying existing surveillance systems, many used to track influenza and other respiratory viruses annually, to track COVID-19.
- Visits to outpatient providers and emergency departments for illnesses with symptom presentation similar to COVID-19 are elevated compared to what is normally seen at this time of year. At this time, there is little influenza virus circulation.
- The overall cumulative COVID-19 associated hospitalization rate is 4.6 per 100,000, with the highest rates in persons 65 years and older (13.8 per 100,000) and 50-64 years (7.4 per 100,000). These rates are similar to what is seen at the beginning of an annual influenza epidemic.
- The percentage of deaths attributed to pneumonia and influenza increased to 8.2% and is above the epidemic threshold of 7.2%. The percent of deaths due to pneumonia has increased sharply since the end of February, while those due to influenza increased modestly through early March and declined this week. This could reflect an increase in deaths from pneumonia caused by non-influenza associated infections including COVID-19.
- NCHS is monitoring deaths associated with COVID-19 and made those data publicly available on April 3, 2020.
The number of specimens tested for SARS-CoV-2, the virus that causes COVID-19, and reported to CDC by public health laboratories and a subset of clinical and commercial laboratories in the United States are summarized below. At this point in the outbreak, all laboratories are performing primary diagnostic functions, therefore the percentage of specimens testing positive across laboratory types can be used to monitor trends in COVID-19 activity. As the outbreak progresses, it is possible that different types of laboratories will take on different roles and the data interpretation may need to be modified.
| Week 13 | Cumulative since March 1, 2020 | |
|---|---|---|
| No. of specimens tested | 75,852 | 193,431 |
| Public Health Laboratories | 53,472 | 156,225 |
| Clinical Laboratories | 22,380 | 37,206 |
| No. of positive specimens | 10,982 (14.5%) | 22,601 (11.7%) |
Public Health Laboratories
Clinical Laboratories
Outpatient/Emergency Department Illness
Two syndromic surveillance systems are being used to monitor trends in outpatient and emergency department visits that may be related to COVID-19. Each system monitors a slightly different syndrome and together these systems provide a more comprehensive picture of mild to moderate COVID-19 illness than either would individually. Both systems are currently being affected by recent changes in health care seeking behavior, including increasing use of telemedicine and recommendations to limit emergency department (ED) visits to severe illness, as well as increased social distancing. These changes affect the numbers of people and their reasons for seeking care in the outpatient and ED settings.
ILINet
The U.S. Outpatient Influenza-like Illness Surveillance Network (ILINet) provides data on visits for influenza-like illness (ILI) (fever [≥100○F] and cough and/or sore throat) to approximately 2,600 primary care providers, emergency departments and urgent care centers in all 50 states, Puerto Rico and the U.S. Virgin Islands. Mild COVID-19 illness presents with symptoms similar to ILI so ILINet is being used to track trends of mild COVID-19 illness and allows for comparison with prior influenza seasons.
Nationwide during week 13, 5.4% of patient visits reported through ILINet were due to ILI. This percentage is above the national baseline of 2.4% but represents the first week of a decline after three weeks of increase beginning in early March. The percent of visits for ILI decreased in children and adults but increased slightly for those 65 years of age and older. Nationally, laboratory confirmed influenza activity as reported by clinical laboratories continues to decrease which, along with changes in healthcare seeking behavior and the impact of social distancing, is likely driving the decrease in ILI activity.
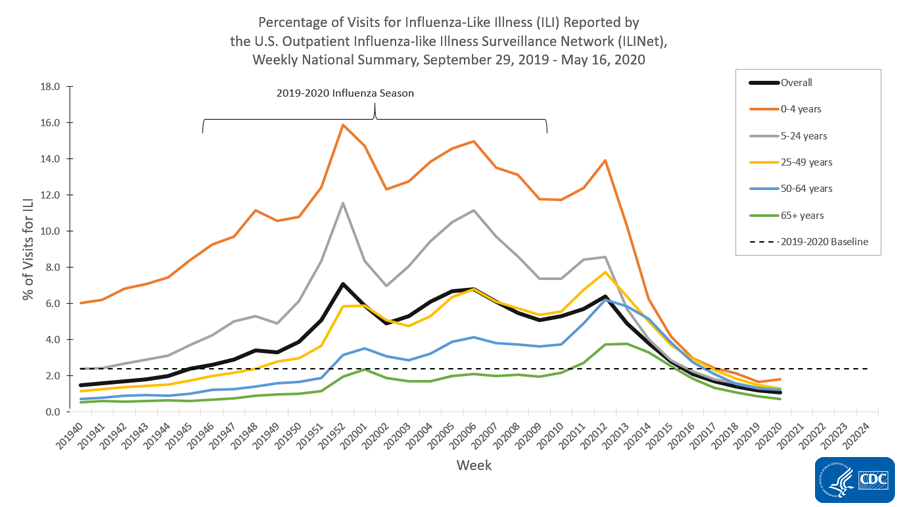
* Age-group specific percentages should not be compared to the national baseline.
On a regional level, the percentage of outpatient visits for ILI ranged from 3.7% to 12.2% during week 13; all regions reported a percentage of outpatient visits for ILI above their regions-specific baselines. Nine of the 10 surveillance regions reported a decrease in percentage of outpatient visits for ILI however region 2 (NY, NJ, PR) reported a slight increase. National, regional and state level ILI data can be found on FluView Interactive.
ILI Activity Levels
Data collected in ILINet are used to produce a measure of ILI activity for all 50 states, Puerto Rico, the District of Columbia and New York City. The mean reported percentage of visits due to ILI for the current week is compared to the mean reported during non-influenza weeks, and the activity levels correspond to the number of standard deviations below, at or above the mean.
The number of jurisdictions at each activity level during week 13 and the change compared to the previous week are summarized in the table below and shown in the following maps. The decreasing percentage of visits for ILI described above are reflected in this week’s ILI activity levels.
| Activity Level | Number of Jurisdictions | |
|---|---|---|
| Week 13 | Compared to Previous Week | |
| Very High | 15 | -13 |
| High | 16 | +6 |
| Moderate | 5 | -3 |
| Low | 5 | +2 |
| Minimal | 12 | +8 |
| Insufficient Data* | 1 | No change |
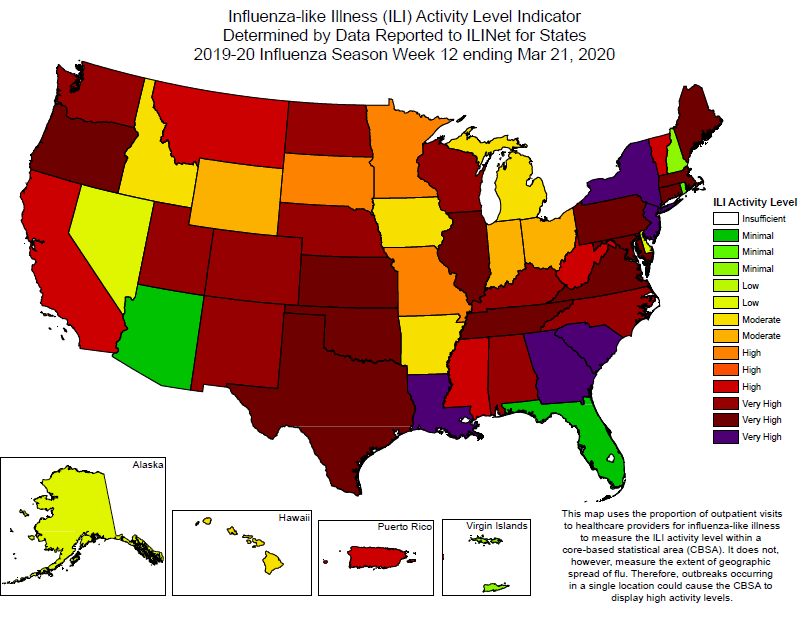
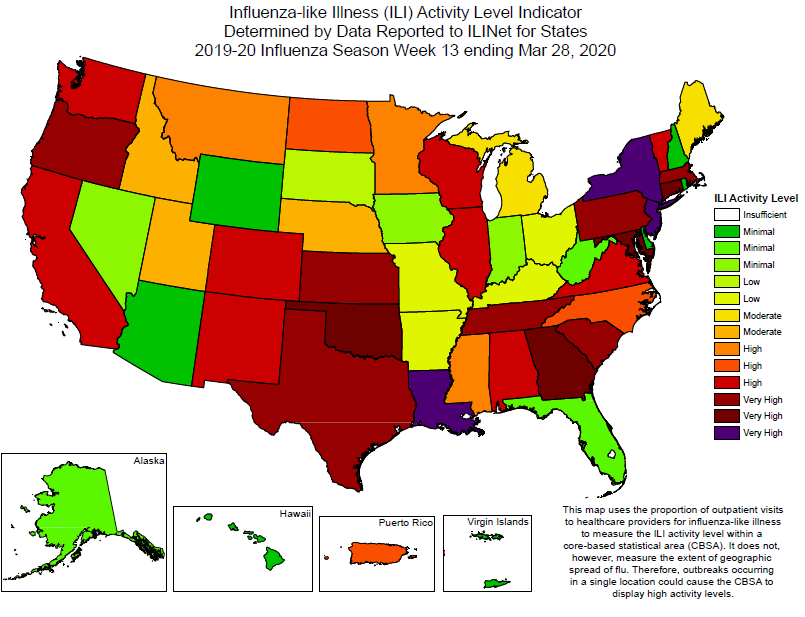
The “very high” activity level was recently developed and will be reflected in other postings of the ILINet activity map when the map is updated on April 10, 2020.
Additional information about medically attended visits for ILI reported through ILINet:
Surveillance Methods | FluView Interactive: National, Regional, and State Data or ILI Activity Map
National Syndromic Surveillance Program (NSSP): Emergency Department (ED) Visits
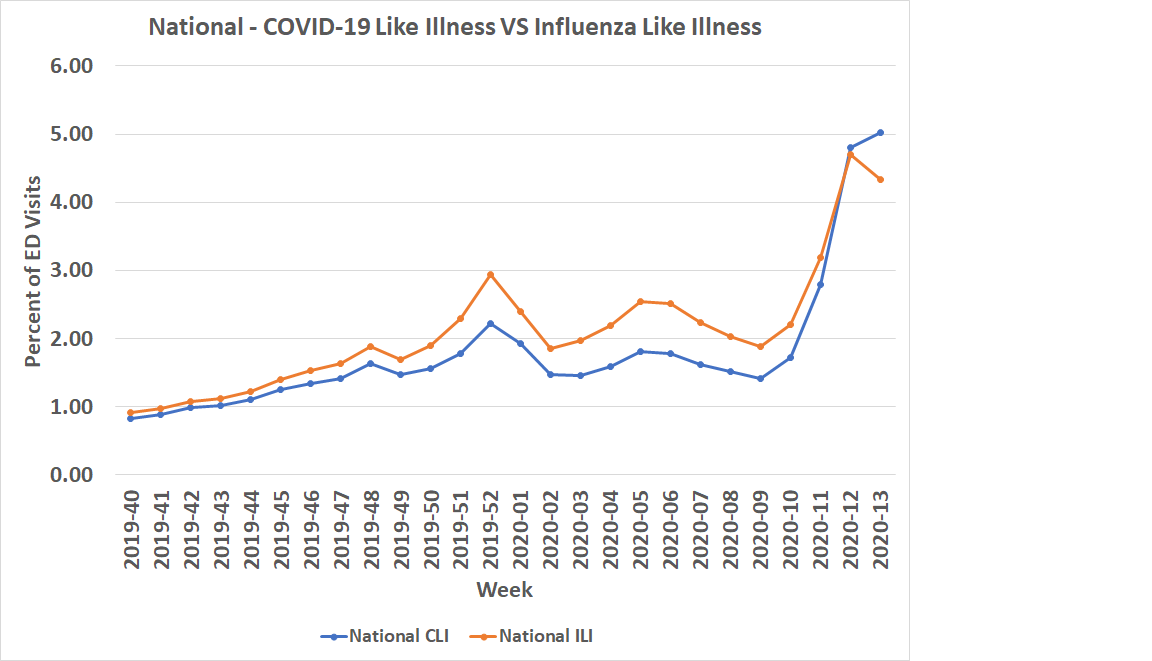
NSSP is a collaboration among CDC, federal partners, local and state health departments, and academic and private sector partners to collect, analyze, and share electronic patient encounter data received from multiple health care settings. To track trends of potential COVID-19 visits, visits for COVID-19-like illness (CLI) (fever and cough or shortness of breath or difficulty breathing) and ILI to a subset of emergency departments in 47 states are being monitored.
Nationwide during week 13, 5.0% of emergency department visits captured in NSSP were due to CLI and 4.3% were due to ILI. The percentage of visits for both CLI and ILI increased from weeks 10 through 12; however, during week 13 the percentage of visits for ILI declined slightly, while the percentage of visits for CLI continued to increase. The increase in the percentage of visits for CLI nationally is being driven by increasing CLI activity in 3 regions (regions 1, 2 and 6), while in the remaining regions, the percentage of visits to EDs for CLI declined (6 regions) or remained stable (1 region) during week 13 compared to week 12. Region 2 is the only region that experienced an increase in the percentage of visits to EDs for ILI during week 13.
Hospitalizations
The COVID-19-Associated Hospitalization Surveillance Network (COVID-NET) conducts population-based surveillance for laboratory-confirmed COVID-19-associated hospitalizations in select counties participating in the Emerging Infections Program (EIP) and Influenza Hospitalization Surveillance Project (IHSP) states. COVID-NET-estimated hospitalization rates will be updated weekly.
A total of 1,482 laboratory-confirmed COVID-19-associated hospitalizations were reported by COVID-NET sites between March 1, 2020 and March 28, 2020. The overall cumulative hospitalization rate was 4.6 per 100,000 population with the highest rates in those aged 65 years and older (13.8 per 100,000) followed by adults aged 50-64 years (7.4 per 100,000).
Additional hospitalization surveillance information: COVID-Net Interactive
Mortality Surveillance
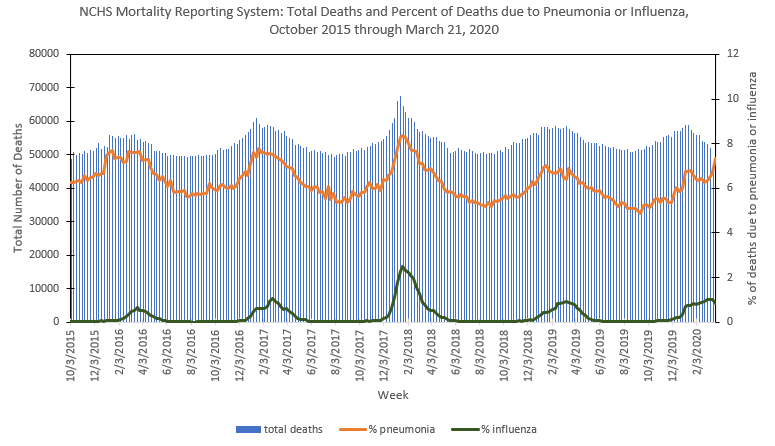
Based on National Center for Health Statistics (NCHS) mortality surveillance data available on April 2, 2020, 8.2% of the deaths occurring during the week ending March 21, 2020 (week 12) were due to pneumonia and influenza (P&I). This percentage is above the epidemic threshold of 7.2% for week 12. The increase in P&I percentage is being driven primarily by an increase in pneumonia deaths (excluding deaths where influenza is also listed as a cause of death). The percentage of deaths due to pneumonia has increased sharply since the end of February, while those due to influenza increased at a more modest rate through early March and declined slightly during the week ending March 21. This could reflect an increase in deaths from pneumonia caused by non-influenza associated infections including COVID-19.
NCHS is monitoring deaths associated with COVID-19. Those data will be summarized in this report starting next week, but a preliminary analysis indicates that approximately half of the deaths with COVID-19 listed as a cause of death also include pneumonia as a cause of death. For this reason, in addition to the substantial decrease in influenza activity and the fact that the P&I epidemic threshold is driven by the percentage of pneumonia deaths occurring in the same time period during the past 5 years, comparisons of the P&I percentage to the epidemic threshold provides an indicator of pneumonia deaths in excess of what would otherwise be expected.
Pneumonia and Influenza (P&I) Mortality from the National Center for Health Statistics Mortality Surveillance System
Data through the week ending March 21, 2020, as of April 2, 2020
Additional NCHS mortality surveillance information:
Surveillance Methods for P&I Calculations | FluView Interactive for P&I data | Provisional Death Counts for COVID-19