Recommendations for Fully Vaccinated People
COVID-19 Homepage
A Tragic Milestone
Interpretive Summary for May 13, 2022
A Tragic Milestone

The first COVID-19 death in the United States was recorded the week of January 11, 2020. More than two years later, we are approaching a tragic milestone: one million lives lost to COVID-19. The toll of this disease, the continued loss of life around the world, and the impact on our nation has been heartbreaking. Beyond causing sickness and death, the pandemic has triggered education disruptions, job loss, separation from friends and family, food insecurity, financial burden, and an unprecedented mental health crisis. By October 2021, more than 140,000 children in the United States had lost a parent or caregiver to COVID-19. Since then the number has risen to more than 251,000.
The pandemic has affected everyone deeply, but some have experienced the burden of COVID-19 more than others. The past two years have shed light on the fact that health equity is still not a reality. Many racial and ethnic minority groups, older adults, people with disabilities, and people living in rural areas have been disproportionately impacted, putting them more at risk of severe illness and death from COVID-19. Efforts to tailor programs and messages must continue to ensure that everyone has equitable access to information, resources, vaccines, and treatments. When we focus our public health efforts on health equity, all communities will be stronger, safer, healthier, and more resilient.
Every life lost to COVID-19 is a tragedy and should be a reminder to continue taking precautions to prevent further serious illness and death. We have more tools now, like powerful vaccines and treatments, to protect ourselves and the people around us. We must continue to do our part to get vaccinated, remain up to date, and encourage others to do the same, to reduce the amount of COVID-19 in our communities, and protect those who are at increased risk of severe illness and death.
Note to Readers: The COVID-19 pandemic has had a major effect on our lives. Many of us are facing challenges and losses that can be stressful and overwhelming. CDC has resources to help people with the range of emotions they may face. For information on connecting with a trained mental health professional, visit the CDC webpage People Seeking Help.
- COVID Data Tracker is now available in Spanish. Visit Herramienta de seguimiento de datos del COVID-19 de los CDC.
- COVID Data Tracker’s Vaccine Effectiveness page was updated to highlight the most current relevant studies and findings, allowing for easier interpretation. The page includes a summary table of CDC-authored vaccine effectiveness studies published in the previous month, as well as key findings from the studies by age group.
- COVID Data Tracker’s Communications Toolkit now includes a resource that displays COVID-19 Community Levels over time.
COVID-19 Community Levels
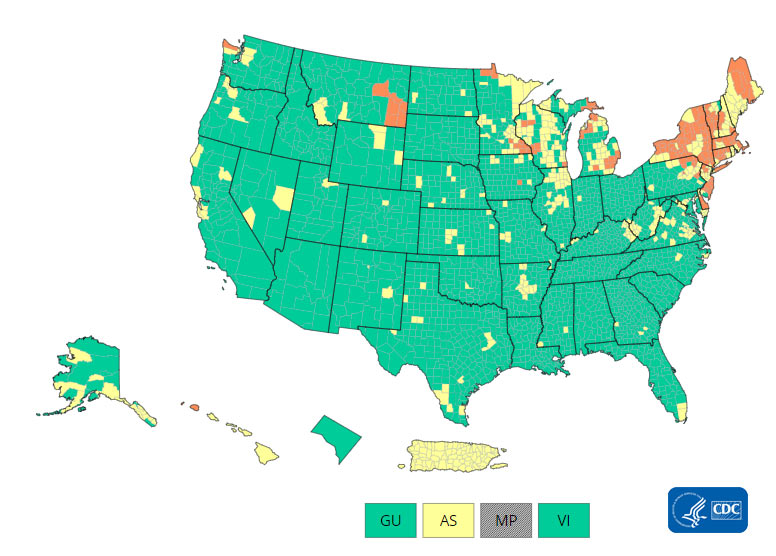
As of May 12, 2022, there are 137 (4.25%) counties, districts, or territories with a high COVID-19 Community Level, 453 (14.07%) counties with a medium Community Level, and 2,630 (81.68%) counties with a low Community Level. This represents a small (+1.77 percentage points) increase in the number of high-level counties, a moderate (+4.10 percentage points) increase in the number of medium-level counties, and a corresponding (−5.87 percentage points) decrease in the number of low-level counties. Eight (15.38%) of 52 jurisdictions had no high- or medium-level counties this week.
To check your COVID-19 Community Level, visit COVID Data Tracker.
Reported Cases
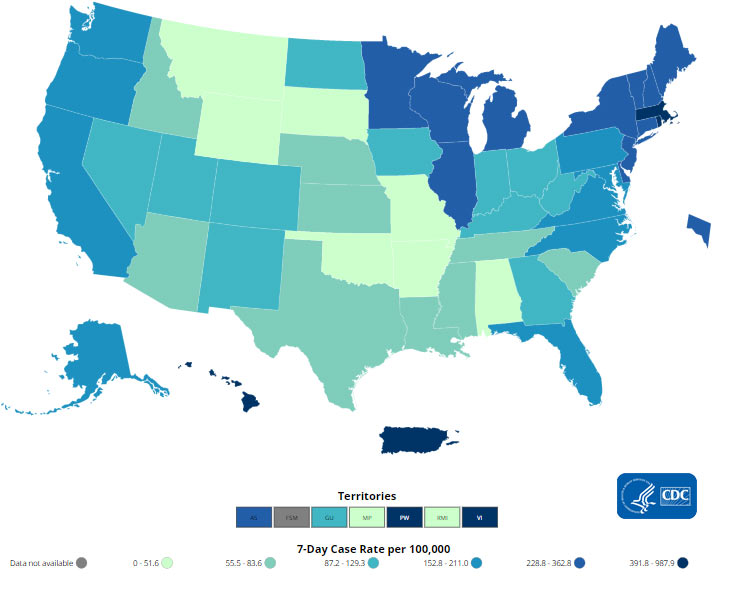
As of May 11, 2022, the current 7-day moving average of daily new cases (84,778) increased 30.7% compared with the previous 7-day moving average (64,863). A total of 82,087,117 COVID-19 cases have been reported in the United States as of May 11, 2022.
CDC Nowcast projections* for the week ending May 7, 2022, estimate the combined national proportion of lineages designated as Omicron to be 100%. There are several lineages of Omicron (B.1.1.529, BA.1, BA.2, BA.3, BA.4, and BA.5), and within each are multiple sublineages. COVID Data Tracker shows the proportions of Omicron lineages grouped as follows: the B.1.1.529 lineage (includes BA.1, BA.3, BA.4 and BA.5), the BA.1.1** lineage, the BA.2 lineage, and the BA.2.12.1 lineage. The predominant Omicron lineage in the United States is BA.2. The national proportion of BA.2 is projected to be 56.4% (95% PI 49.3-63.3%). The national proportion of BA.2.12.1 is projected to be 42.6% (95% PI 35.6-49.9%). BA.1.1 is projected to be 0.6% (95% PI 0.5-0.8%) and B.1.1.529 (BA.1, BA.3, BA.4 and BA.5) is projected to be 0.2% (95% PI 0.1-0.4%). Omicron is predicted to be 100% in all HHS regions.
82,087,117
Total Cases Reported
82,087,117
Total Cases Reported
84,778
Current 7-Day Average***
84,778
Current 7-Day Average***
64,863
Prior 7-Day Average
64,863
Prior 7-Day Average
30.7%
Change in 7-Day Average since Prior Week
30.7%
Change in 7-Day Average since Prior Week
*The median time from specimen collection to sequence data reporting is about 3 weeks. As a result, weighted estimates for the most recent few weeks may be unstable or unavailable. CDC’s Nowcast is a data projection tool that helps fill this gap by generating timely estimates of variant proportions for variants that are circulating in the United States. View Nowcast estimates on CDC’s COVID Data Tracker website on the Variant Proportions page.
**For national data, the proportion of BA.1.1 is shown separately. For regional data, the proportion of BA.1.1 is also aggregated with B.1.1.529.
***Historical cases are excluded from daily new cases and 7-day average calculations until they are incorporated into the dataset for the applicable date. Of 522,870 historical cases reported retroactively, 5 were reported in the current week and 2,316 were reported in the prior week.
Vaccinations
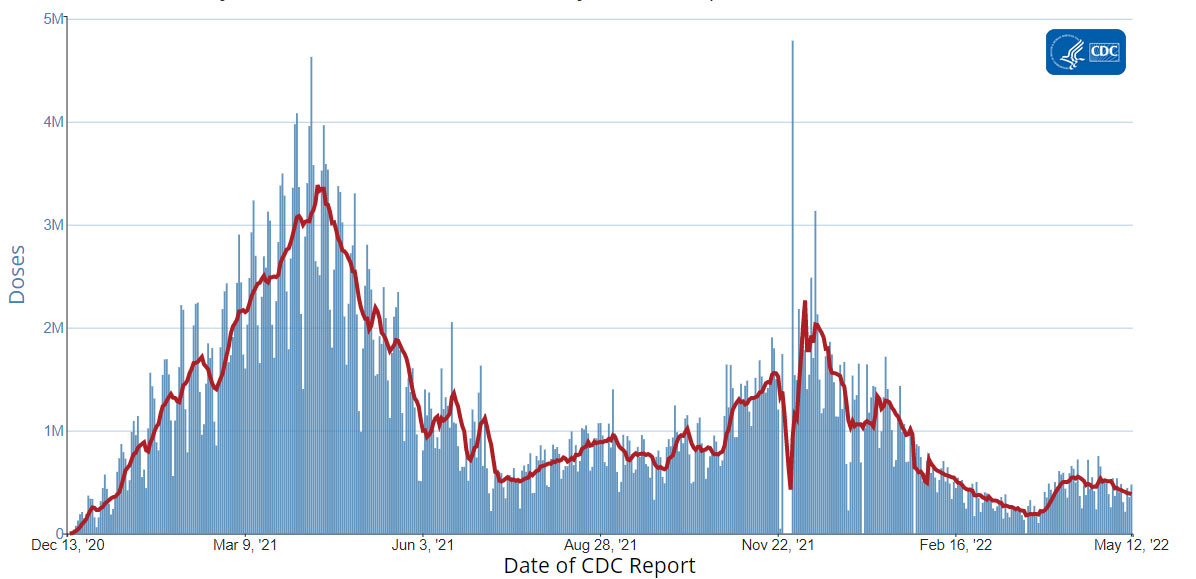
The U.S. COVID-19 Vaccination Program began December 14, 2020. As of May 12, 2022, 580.0 million vaccine doses have been administered in the United States. Overall, about 258.3 million people, or 77.8% of the total U.S. population, have received at least one dose of vaccine. About 220.3 million people, or 66.3% of the total U.S. population, have been fully vaccinated.* Of those fully vaccinated, about 101.5 million people have received a booster dose,** but 49.4% of the total booster-eligible population has not yet received a booster dose. As of May 11, 2022, the 7-day average number of administered vaccine doses reported (by date of CDC report) to CDC per day was 390,306, an 11.1% decrease from the previous week.
CDC’s COVID Data Tracker displays vaccination trends by age group, race/ethnicity, and urban/rural status. To see trends by age group and race/ethnicity, visit the Vaccination Demographic Trends tab. To see trends by urban/rural status, visit the COVID-19 Vaccination Equity tab.
580,038,981
Vaccine Doses Administered
580,038,981
Vaccine Doses Administered
258,284,015
People who received at least one dose
258,284,015
People who received at least one dose
220,287,778
People who are fully vaccinated*
220,287,778
People who are fully vaccinated*
77.8%
Percentage of the U.S. population that has received at least one dose
77.8%
Percentage of the U.S. population that has received at least one dose
66.3%
Percentage of the U.S. population that has been fully vaccinated*
66.3%
Percentage of the U.S. population that has been fully vaccinated*
+0.2
Percentage point increase from last week
+0.2
Percentage point increase from last week
+0.1
Percentage point increase from last week
+0.1
Percentage point increase from last week
*Represents the number of people who have received the second dose in a two-dose COVID-19 vaccine series (such as the Pfizer-BioNTech or Moderna vaccines) or one dose of the single-shot Johnson & Johnson’s Janssen vaccine.
**Represents the number of people who are fully vaccinated and have received another dose of COVID-19 vaccine since August 13, 2021. This includes people who received their first additional dose or booster.
Hospitalizations
New Hospital Admissions
The current 7-day daily average for May 4–10, 2022, was 2,629. This is a 17.5% increase from the prior 7-day average (2,238) from April 27–May 3, 2022.
4,671,162
Total New Admissions
4,671,162
Total New Admissions
2,629
Current 7-Day Average
2,629
Current 7-Day Average
2,238
Prior 7-Day Average
2,238
Prior 7-Day Average
+17.5%
Change in 7-Day Average
+17.5%
Change in 7-Day Average
The start of consistent reporting of hospital admissions data was August 1, 2020.
Daily Trends in Number of New COVID-19 Hospital Admissions in the United States
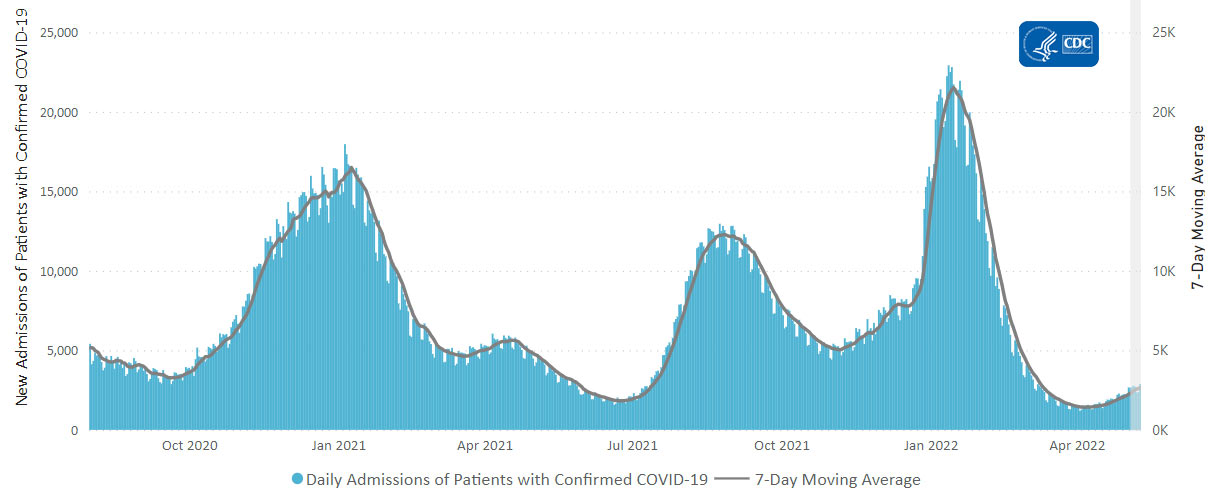
New admissions are pulled from a 10 am EDT snapshot of the HHS Unified Hospital Data – Analytic Dataset. Due to potential reporting delays, data from the most recent 7 days, as noted in the figure above with the grey bar, should be interpreted with caution. Small shifts in historic data may also occur due to changes in the Centers for Medicare & Medicaid Services (CMS) Provider of Services file, which is used to identify the cohort of included hospitals.
COVID-NET: Hospitalization Rates among Adults Ages 65 Years and Older
CDC’s Coronavirus Disease 2019-Associated Hospitalization Surveillance Network (COVID-NET) shows that overall rates of COVID-19-associated hospitalizations have increased since the week ending April 2, 2022. Notably, rates among adults ages 65 years and older have seen the sharpest increase in rates, from 6.5 per 100,000 population on April 2, to 15.6 per 100,000 population on April 30. Among this group, older adults ages 85 and older have had the largest increase in hospitalization rates, increasing from 14.8 per 100,000 population on April 2, to 45.4 per 100,000 population on April 30.
Hospitalization Rates among Adults Ages 65 Years and Older
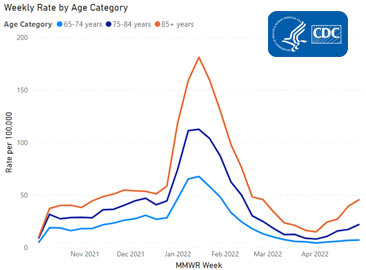
The Coronavirus Disease 2019 (COVID-19)-Associated Hospitalization Surveillance Network (COVID-NET) is an additional source for hospitalization data collected through a network of more than 250 acute-care hospitals in 14 states (representing ~10% of the U.S. population). Detailed data on patient demographics, including race/ethnicity, underlying medical conditions, medical interventions, and clinical outcomes, are collected using a standardized case reporting form.
Deaths
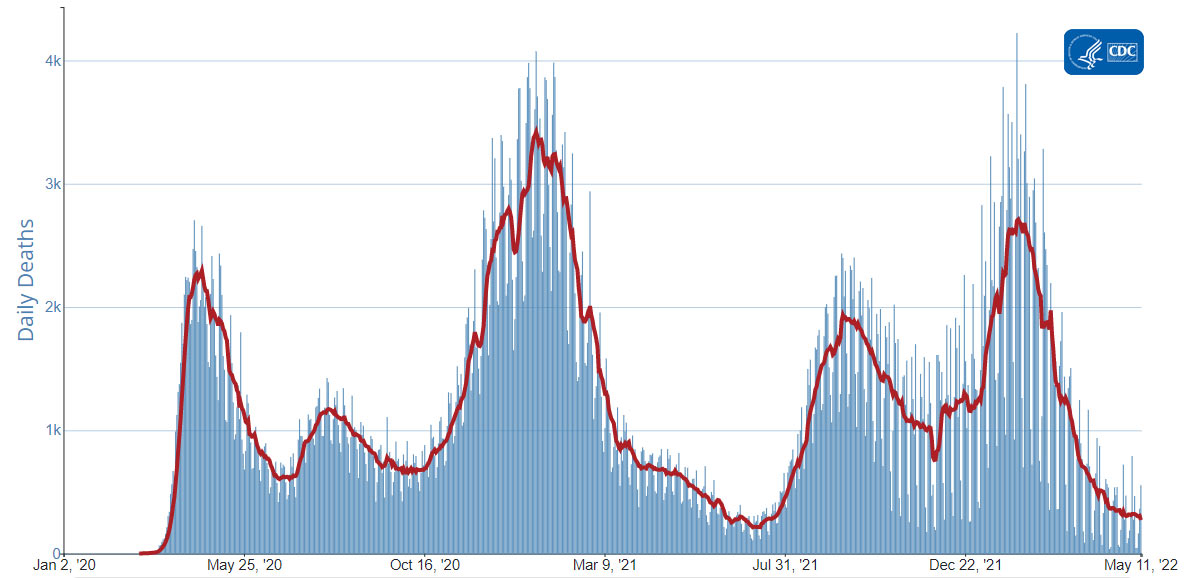
The current 7-day moving average of new deaths (273) has decreased 15.4% compared with the previous 7-day moving average (322). As of May 11, 2022, a total of 996,376 COVID-19 deaths have been reported in the United States.
996,376
Total Deaths Reported
996,376
Total Deaths Reported
273
Current 7-Day Average*
273
Current 7-Day Average*
322
Prior 7-Day Average
322
Prior 7-Day Average
-15.4%
Change in 7-Day Average Since Prior Week
-15.4%
Change in 7-Day Average Since Prior Week
*Historical deaths are excluded from the daily new deaths and 7-day average calculations until they are incorporated into the dataset by their applicable date. Of 21,721 historical deaths reported retroactively, 0 were reported in the current week; and 303 were reported in the prior week.
Daily Trends in Number of COVID-19 Deaths in the United States Reported to CDC

7-Day moving average
 More Death Data
Testing
The percentage of COVID-19 NAATs (nucleic acid amplification tests)* that are positive (percent positivity) is increasing in comparison to the previous week. The 7-day average of percent positivity from NAATs is now 9.1%. The 7-day average number of tests reported for April 29–May 5, 2022, was 746,765, down 4.6% from 783,008 for the prior 7 days.
876,537,308
Total Tests Reported
876,537,308
Total Tests Reported
746,765
7-Day Average Tests Reported
746,765
7-Day Average Tests Reported
9.1%
7-Day Average % Positivity
9.1%
7-Day Average % Positivity
7.1%
Previous 7-Day Average % Positivity
7.1%
Previous 7-Day Average % Positivity
+1.98
Percentage point change in 7-Day Average % Positivity since Prior Week
+1.98
Percentage point change in 7-Day Average % Positivity since Prior Week
*Test for SARS-CoV-2, the virus that causes COVID-19
Wastewater Surveillance
COVID Data Tracker’s Wastewater Surveillance tab tracks levels, changes, and detections of SARS-CoV-2* viral RNA in wastewater at more than 900 testing sites across the country.
Currently, most of the country is reporting low to moderate SARS-CoV-2 levels in wastewater. However, around 20% of sites are currently seeing some of the highest levels for those sites since December 1, 2021. More than half of all sites reporting wastewater data are experiencing a modest increase in SARS-CoV-2 levels. These increases often reflect minor changes from very low levels to levels that are still low. It’s important to note that even a small increase when levels are low can appear like a dramatic increase in the percent change. For more information on how to use wastewater data, visit CDC’s website.
*The virus that causes COVID-19
SARS-CoV-2 Levels in Wastewater by Site
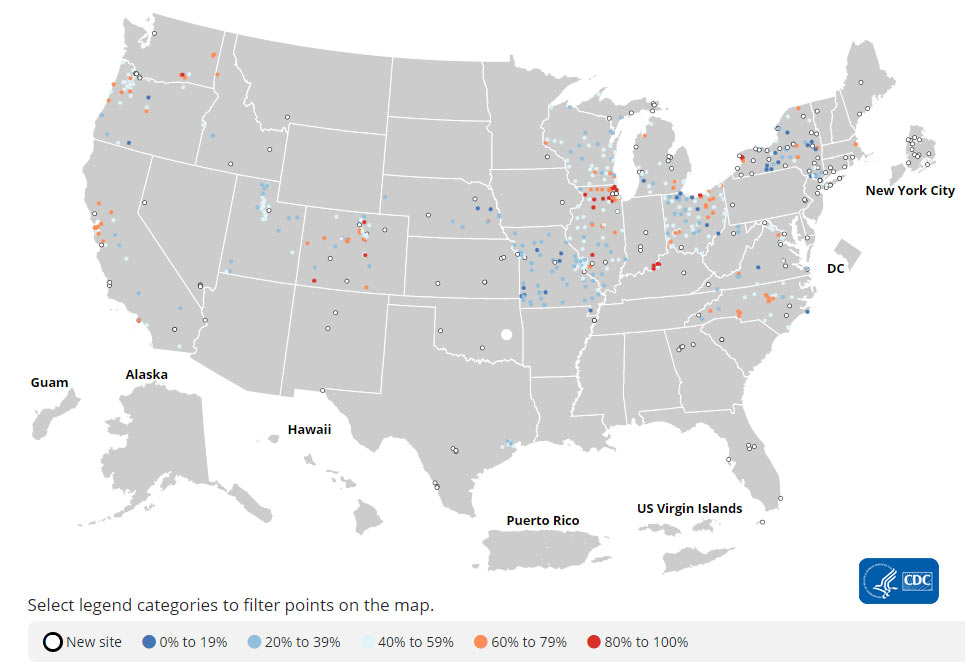
0% means levels are the lowest they have been at the site; 100% means levels are the highest they have been at the site.
A Closer Look
Understanding COVID-19 Mortality Surveillance Systems
Mortality (death) is a key metric in epidemiologic investigations. During the pandemic, CDC has used three main sources of death data for COVID-19 surveillance:
- The National Center for Health Statistics’ (NCHS) National Vital Statistics System (NVSS): NVSS data are the gold standard for tracking deaths in the United States across a variety of health conditions, but they require time to collect and verify. NVSS collects official death certificate data from 57 jurisdictions (public health agencies in all 50 states; Washington, D.C.; New York City; and five territories), receiving about 60% of records within 10 days of the date of death. NCHS codes the cause of death, reviews the death certificate, and processes the data for use in surveillance and final mortality statistics. The coded certificates are shared back with the states, and these become the official counts of cause of death. NCHS publishes preliminary counts by cause of death with about a two-week lag and publishes final counts by cause of death 11 to 12 months after the conclusion of the calendar year. Sometimes, the NVSS data may be slower than case-based surveillance (lags of one to eight weeks or more), but they have more complete and accurate information on demographics and date of death.
- COVID-19 Aggregate Case and Death Surveillance (ACS): In January 2020, CDC established the ACS system for tracking aggregate COVID-19 case and death data. ACS provides the timeliest information of the three systems, publishing the daily number of new and cumulative COVID-19 cases and deaths from each jurisdiction and summarizing the day-to-day changes. The data are based on date of report to the public health agency, but the actual date of death could be up to a few weeks earlier. The data are considered preliminary because the official death certificates might not yet have been processed with a coded cause of death. ACS data have proved critical for COVID-19 surveillance and continue to inform CDC’s response operations.
- Case-level surveillance data: These data are collected at the individual level and provide more detailed information on cases and deaths than aggregate case reporting. Case-level data include patient demographics, such as age, race and ethnicity, signs and symptoms of illness, underlying health conditions, and possible routes of exposure. Public health agencies routinely link their case surveillance data and death registries to determine if and when a person may have died. The death information can be collected before or after NVSS death certificate processing. This source, like the aggregate case data, might underestimate the number of deaths because not everyone who has COVID-19 is officially identified as a case.
Mortality data continue to play a central role in the COVID-19 pandemic. The use of multiple data streams has informed CDC recommendations and established new data collection methods in preparation for future responses. All three CDC mortality systems yield roughly similar death trends but provide different levels of timeliness and detail. Across these three different systems, the collection of similar death counts, reinforces our confidence in the death statistics. The breadth of data collected during the COVID-19 response is unprecedented and would not be possible without the strong public health collaboration between CDC and its jurisdictional partners. Mortality data continue to be collected, aggregated, and made public via CDC’s COVID Data Tracker.
CDC continues to examine data collection procedures and is working to apply lessons learned from the COVID-19 pandemic in future efforts. For more information, visit CDC’s Public Health and Data Authority website.

