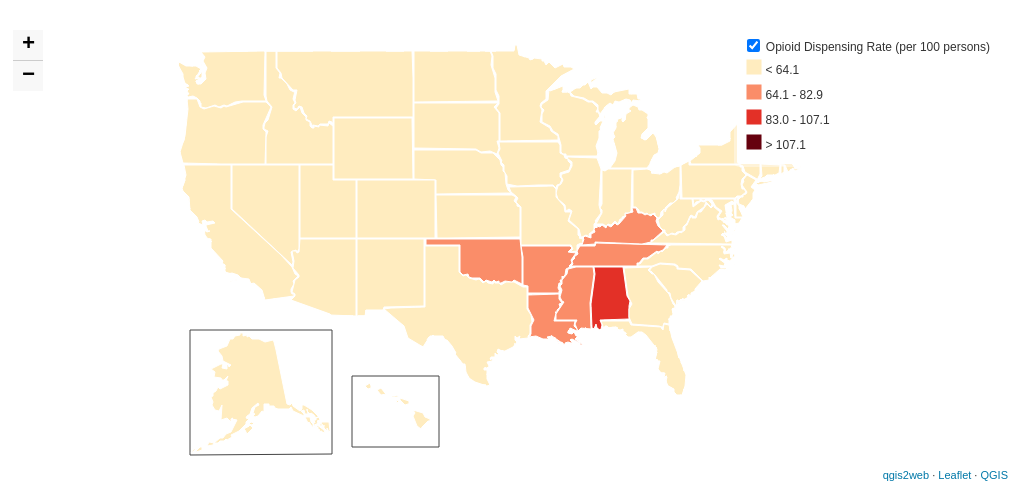
U.S. State Opioid Dispensing Rates, 2019
About the Maps
Starting in 2019, prescriptions were based on the location of the prescriber, rather than the location of the pharmacy. For detailed information about these maps, including data sources, please visit the U.S. Opioid Dispensing Rate Maps page.
| State | Abbreviation | Opioid Dispensing Rate per 100 |
|---|---|---|
| United States | US | 46.7 |
| Alaska | AK | 39.1 |
| Alabama | AL | 85.8 |
| Arkansas | AR | 80.9 |
| Arizona | AZ | 44.1 |
| California | CA | 30.9 |
| Colorado | CO | 40 |
| Connecticut | CT | 40.5 |
| District of Columbia | DC | 39.9 |
| Delaware | DE | 51.6 |
| Florida | FL | 45.4 |
| Georgia | GA | 57.9 |
| Hawaii | HI | 30.3 |
| Iowa | IA | 43 |
| Idaho | ID | 53.4 |
| Illinois | IL | 43.1 |
| Indiana | IN | 60.4 |
| Kansas | KS | 63.7 |
| Kentucky | KY | 72.3 |
| Louisiana | LA | 74.6 |
| Massachusetts | MA | 35.4 |
| Maryland | MD | 42.3 |
| Maine | ME | 44.1 |
| Michigan | MI | 58 |
| Minnesota | MN | 32.1 |
| Missouri | MO | 58.3 |
| Mississippi | MS | 67 |
| Montana | MT | 48.2 |
| North Carolina | NC | 56.7 |
| North Dakota | ND | 38.8 |
| Nebraska | NE | 50.3 |
| New Hampshire | NH | 38.1 |
| New Jersey | NJ | 34.8 |
| New Mexico | NM | 43.4 |
| Nevada | NV | 49.4 |
| New York | NY | 34.8 |
| Ohio | OH | 50.8 |
| Oklahoma | OK | 66 |
| Oregon | OR | 49.1 |
| Pennsylvania | PA | 47 |
| Rhode Island | RI | 40.3 |
| South Carolina | SC | 60.4 |
| South Dakota | SD | 43.9 |
| Tennessee | TN | 74.6 |
| Texas | TX | 42.1 |
| Utah | UT | 51.4 |
| Virginia | VA | 40.7 |
| Vermont | VT | 36.9 |
| Washington | WA | 42.7 |
| Wisconsin | WI | 42.5 |
| West Virginia | WV | 59.4 |
| Wyoming | WY | 49.7 |