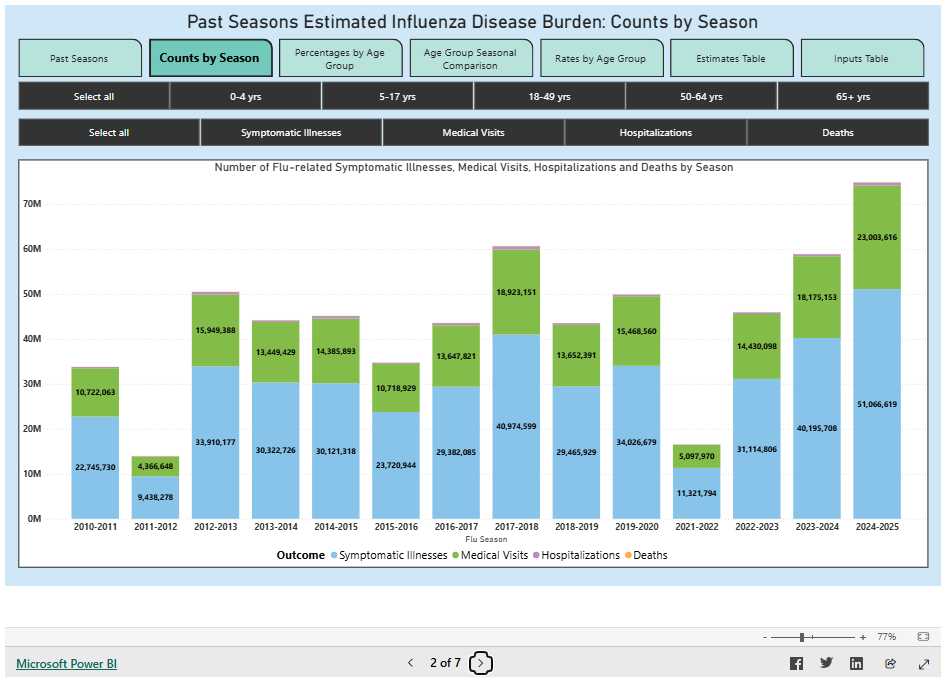
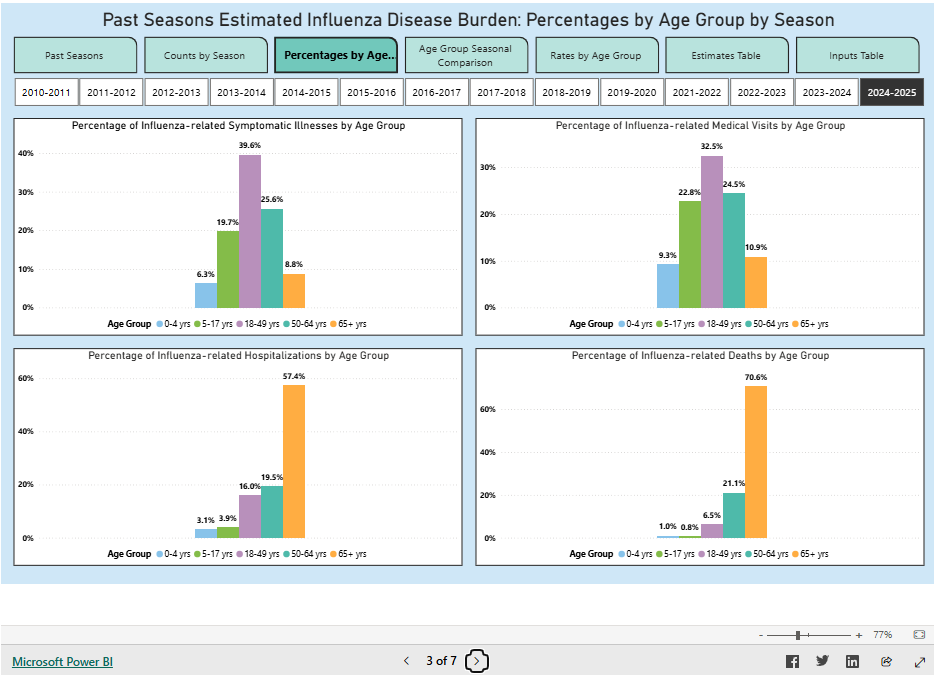
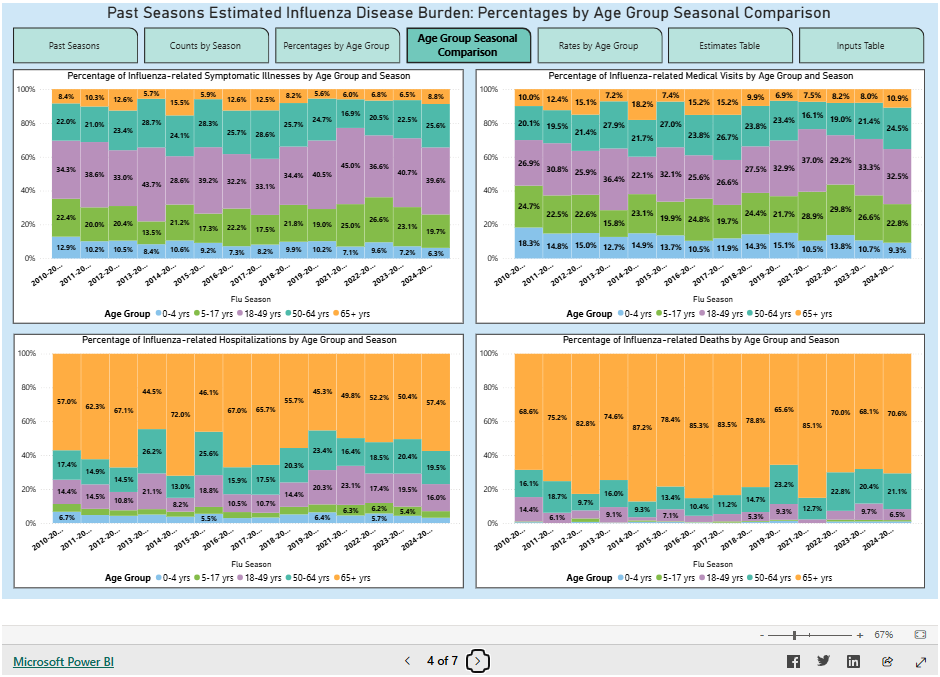
Flu Disease Burden: Past Seasons

Purpose

This page includes information about the estimated burden of influenza (flu) from past seasons beginning with the 2010-2011 flu season using a dashboard. This dashboard includes estimates and rates for past seasons, summary pages comparing seasons and age groups, and a table including the input values for the disease burden model.
Past Seasons

Past Seasons

Estimated flu disease burden and 95% uncertainty interval, all ages by season. US 2010-2011 through 2024-2025 flu season

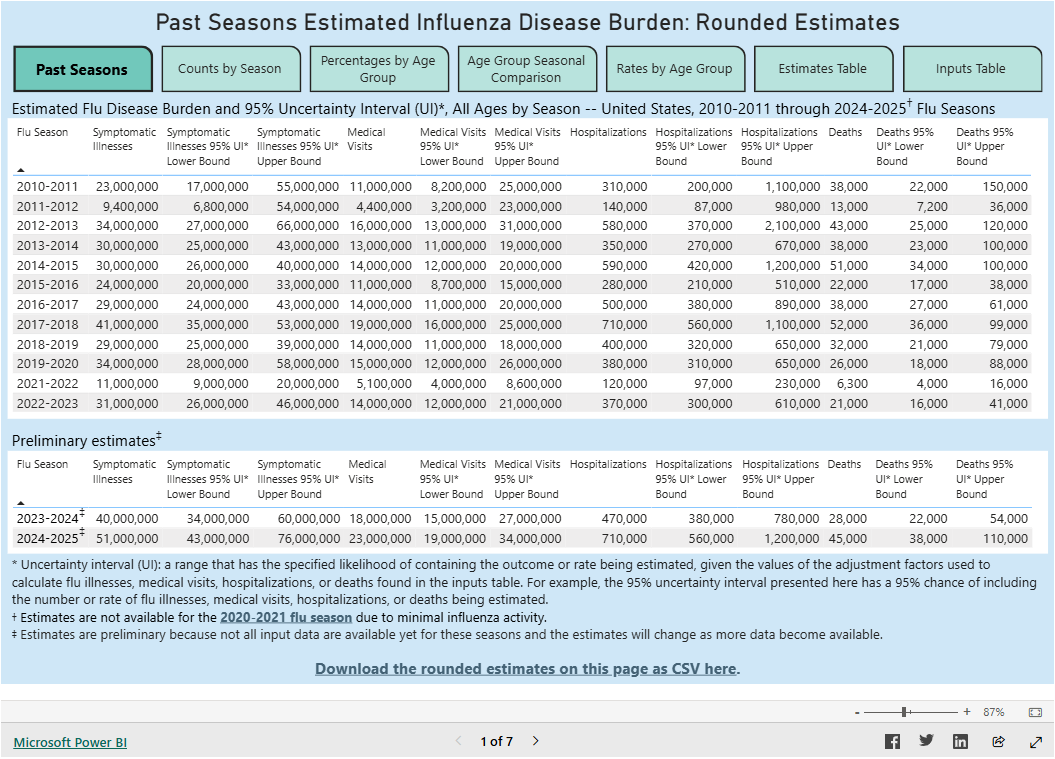
Download the rounded estimates on this page as CSV here.

Number of flu-related symptomatic illnesses, medical visits, hospitalizations, and deaths by season
Percentage of influenza-related symptomatic illnesses, medical visits, hospitalizations, deaths by age group
Percentage of influenza-related symptomatic illnesses, medical visits, hospitalizations, deaths by age group and season
Percentage of influenza-related symptomatic illnesses, medical visits, hospitalizations, and deaths by age group and season
Flu-related illness, medical visit, hospitalization, and death rate and 95% credible interval per 100,000 by season
Estimated flu disease burden and 95% uncertainty interval by season. US 2010-2011 through 2024-2025 flu seasons

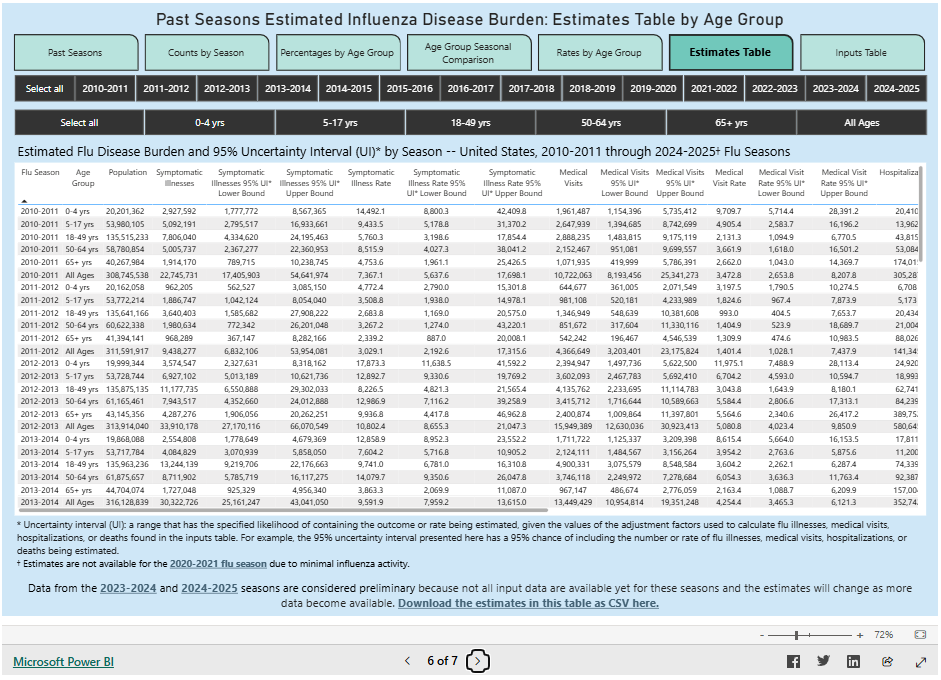
Data from the 2023-2024 and 2024-2025 seasons are considered preliminary because not all input data are available yet for these seasons and the estimates will change as more data become available. Download the estimates in this table as CSV here.

Past seasons estimated influenza disease burden model inputs table by age group

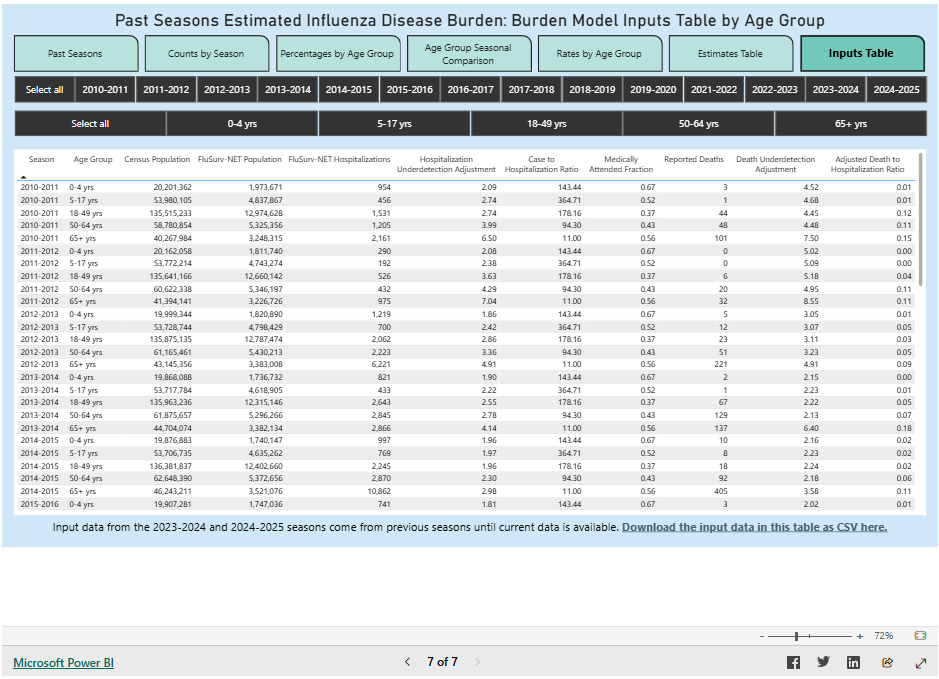
Input data from the 2023-2024 and 2024-2025 seasons come from previous seasons until current data is available. Download the input data in this table as CSV here.

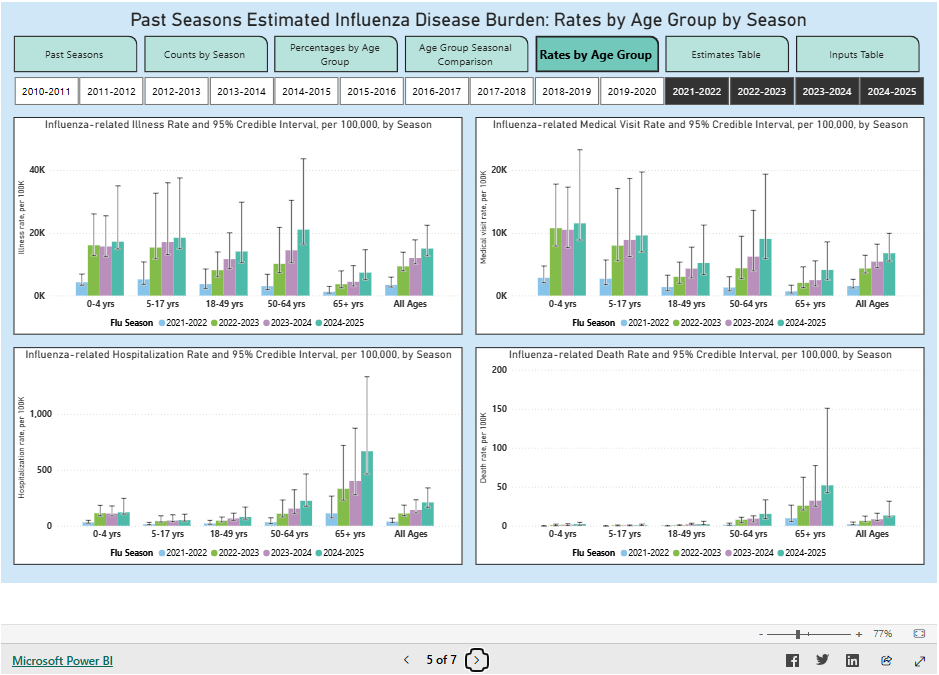
The dashboard above is an interactive tool to access and visualize information about the estimated burden of flu from past seasons, beginning with the 2010-2011 flu season. Pages include data tables for the estimates and rates for past seasons that can be downloaded using links on each page. There are also pages that include visuals designed to more easily compare the burden of flu across seasons, outcomes and between age groups. Information on How CDC Estimates the Burden of Seasonal Influenza in the U.S. and additional information about the 2021-2022, 2022-2023 and 2023-2024 flu seasons are also available.

Content Source:
Error processing SSI file
  • Uncertainty interval: Adjusted estimates are presented in two parts: an uncertainty interval [UI] and a point estimate. The uncertainty interval provides a range in which the true number or rate of flu illnesses, medical visits, hospitalizations, or deaths would be expected to fall if the same study was repeated many times, and it gives an idea of the precision of the point estimate. A 95% uncertainty interval means that if the study were repeated 100 times, then 95 out of 100 times the uncertainty interval would contain the true point estimate. Conversely, in only 5 times out of a 100 would the uncertainty interval not contain the true point estimate.