CDC Estimates of 2009 H1N1 Influenza Cases, Hospitalizations and Deaths in the United States, April 2009 – February 13, 2010
On this Page
- Background
- The Numbers
- Table: CDC Cumulative Estimates of 2009 H1N1 Cases and Related Hospitalizations and Deaths from April 2009 - February 13, 2010
- Graphics Section
- Method to Estimate 2009 H1N1 Cases, Hospitalizations and Deaths
- Background Emerging Infections Program
- Seasonal Influenza-Associated Hospitalizations in the United States
- Seasonal Influenza-Associated Deaths
- Under-Counting of Flu-Related Deaths
- Related Links
March 29, 2010, 10:00 AM ET
April – January 16, 2010 Estimates
April – December 12, 2009 Estimates
April – November 14, 2009 Estimates
April – October 17, 2009 Estimates
Background
Estimating the number of individual flu cases in the United States is very challenging because many people with flu don’t seek medical care and only a small number of those that do seek care are tested. More people who are hospitalized or die of flu-related causes are tested and reported, but under-reporting of hospitalizations and deaths occurs as well. For this reason CDC monitors influenza activity levels and trends and virus characteristics through a nationwide surveillance system and uses statistical modeling to estimate the burden of flu illness (including hospitalizations and deaths) in the United States.
When the 2009 H1N1 flu outbreak began in April 2009, CDC began tracking and reporting the number of laboratory-confirmed 2009 H1N1 cases, hospitalizations and deaths as reported by states to CDC. These initial case counts (which were discontinued on July 24, 2009), and subsequent ongoing laboratory-confirmed reports of hospitalizations and deaths, are thought to represent a significant undercount of the actual number of 2009 H1N1 flu cases in the United States. A paper in Emerging Infectious Diseases authored by CDC staff entitled “Estimates of the Prevalence of Pandemic (H1N1) 2009, United States, April–July 2009” reported on a study to estimate the prevalence of 2009 H1N1 based on the number of laboratory-confirmed cases reported to CDC. Correcting for under-ascertainment, the study found that every case of 2009 H1N1 reported from April – July represented an estimated 79 total cases, and every hospitalized case reported may have represented an average of 2.7 total hospitalized people. CDC then began working on a way to estimate, in an ongoing way, the impact of the 2009 H1N1 pandemic on the U.S. in terms of 2009 H1N1 cases, hospitalizations and deaths. CDC developed a method to provide an estimated range of the total number of 2009 H1N1 cases, hospitalizations and deaths in the United States by age group using data on flu associated hospitalizations collected through CDC’s Emerging Infections Program.[e1]
The Numbers
On November 12, 2009 CDC provided the first set of estimates on the numbers of 2009 H1N1 cases and related hospitalizations and deaths in the United States between April and October 17, 2009.
Estimates from April – October 17, 2009:
- CDC estimated that between 14 million and 34 million cases of 2009 H1N1 occurred between April and October 17, 2009. The mid-level in this range was about 22 million people infected with 2009 H1N1.
- CDC estimated that between about 63,000 and 153,000 2009 H1N1-related hospitalizations occurred between April and October 17, 2009. The mid-level in this range was about 98,000 H1N1-related hospitalizations.
- CDC estimated that between about 2,500 and 6,000 2009 H1N1-related deaths occurred between April and October 17, 2009. The mid-level in this range was about 3,900 2009 H1N1-related deaths.
Updated Estimates from April – November 14, 2009
Using the same methodology, CDC updated the estimates to include the time period from April through November 14, 2009 on December 10, 2009.
- CDC estimated that between 34 million and 67 million cases of 2009 H1N1 occurred between April and November 14, 2009. The mid-level in this range was about 47 million people infected with 2009 H1N1.
- CDC estimated that between about 154,000 and 303,000 2009 H1N1-related hospitalizations occurred between April and November 14, 2009. The mid-level in this range was about 213,000 H1N1-related hospitalizations.
- CDC estimated that between about 7,070 and 13,930 2009 H1N1-related deaths occurred between April and November 14, 2009. The mid-level in this range was about 9,820 2009 H1N1-related deaths.
Updated Estimates from April – December 12, 2009
Using the same methodology, CDC updated the estimates to include the time period from April through December 12, 2009.
- CDC estimates that between 39 million and 80 million cases of 2009 H1N1 occurred between April and December 12, 2009. The mid-level in this range is about 55 million people infected with 2009 H1N1.
- CDC estimates that between about 173,000 and 362,000 2009 H1N1-related hospitalizations occurred between April and December 12, 2009. The mid-level in this range is about 246,000 H1N1-related hospitalizations.
- CDC estimates that between about 7,880 and 16,460 2009 H1N1-related deaths occurred between April and December 12, 2009. The mid-level in this range is about 11,160 2009 H1N1-related deaths.
Updated Estimates from April 2009 – January 16, 2010
Using the same methodology, CDC updated the estimates to include the time period from April 2009 through January 16, 2010 on February 12, 2010.
- CDC estimates that between 41 million and 84 million cases of 2009 H1N1 occurred between April 2009 and January 16, 2010. The mid-level in this range is about 57 million people infected with 2009 H1N1.
- CDC estimates that between about 183,000 and 378,000 H1N1-related hospitalizations occurred between April 2009 and January 16, 2010. The mid-level in this range is about 257,000 2009 H1N1-related hospitalizations.
- CDC estimates that between about 8,330 and 17,160 2009 H1N1-related deaths occurred between April 2009 and January 16, 2010. The mid-level in this range is about 11,690 2009 H1N1-related deaths.
Updated Estimates from April 2009 – February 13, 2010
Using the same methodology CDC has again updated the estimates to include the time period from April 2009 through February 13, 2010 on March 12, 2010.
- CDC estimates that between 42 million and 86 million cases of 2009 H1N1 occurred between April 2009 and February 13, 2010. The mid-level in this range is about 59 million people infected with 2009 H1N1.
- CDC estimates that between about 188,000 and 389,000 H1N1-related hospitalizations occurred between April 2009 and February 13, 2010. The mid-level in this range is about 265,000 2009 H1N1-related hospitalizations.
- CDC estimates that between about 8,520 and 17,620 2009 H1N1-related deaths occurred between April 2009 and February 13, 2010. The mid-level in this range is about 12,000 2009 H1N1-related deaths.
Note: Less than 5% of increases in the estimates from one reporting date to the next are the result of delayed reporting in cases, hospitalizations and deaths.
CDC Estimates of 2009 H1N1 Cases and Related Hospitalizations and Deaths from April 2009 - February 13, 2010, By Age Group
| 2009 H1N1 | Mid-Level Range* | Estimated Range* |
| Cases | ||
| 0-17 years | ~19 million | ~14 million to ~28 million |
| 18-64 years | ~34 million | ~24 million to ~50 million |
| 65 years and older | ~6 million | ~4 million to ~8 million |
| Cases Total | ~59 million | ~42 million to ~86 million |
| Hospitalizations | ||
| 0-17 years | ~85,000 | ~60,000 to ~125,000 |
| 18-64 years | ~154,000 | ~109,000 to ~226,000 |
| 65 years and older | ~26,000 | ~19,000 to ~38,000 |
| Hospitalizations Total | ~265,000 | ~188,000 to ~389,000 |
| Deaths | ||
| 0-17 years | ~1,250 | ~890 to ~1,840 |
| 18-64 years | ~9,200 | ~6,530 to ~13,500 |
| 65 years and older | ~1,550 | ~1,100 to ~2,280 |
| Deaths Total | ~12,000 | ~8,520 to ~17,620 |
* Deaths have been rounded to the nearest ten. Hospitalizations have been rounded to the nearest thousand and cases have been rounded to the nearest million. Exact numbers also are available.
The latest estimates released on March 12, 2010 incorporate an additional four weeks of flu data (from January 17, 2010 through February 13, 2010) from the previous estimates released on February 12, 2010.
The latest estimates through February 13, 2010 show a relatively small increase in the total number of 2009 H1N1 cases, hospitalizations and deaths since the previous estimates posted on February 12, 2010. The additional four weeks of flu activity data added to derive these updated estimates correlate with a four week period of ongoing but generally low flu activity in the United States.
The United States experienced its first wave of 2009 H1N1 pandemic activity in the spring of 2009, followed by a second wave of 2009 H1N1 activity in the fall. Activity peaked during the second week in October and then declined quickly to below baseline levels in January. The early rise in flu activity in October is in contrast to non-pandemic influenza seasons. Influenza activity usually peaks in January, February or March. (See graph of peak influenza activity by month in the United States from 1976-2009.) Because 2009 H1N1 activity peaked in late October, the greatest increase in the number of estimated 2009 H1N1 cases, hospitalizations and deaths occurred during the period of April through November 14, 2009. The estimates provided for the subsequent four weeks (through December 12, 2009) showed a modest increase in the total number of 2009 H1N1 cases, hospitalizations and deaths and correlated with decreasing but persistent flu activity nationwide. The estimates updated on February 12, 2010 with data from December 13, 2009 through January 16, 2010, correlate with a five week period of generally low flu activity. While flu activity leveled off and was generally low in the United States from January 17 – February 13, 2010, 2009 H1N1 cases, hospitalizations and deaths have continued to occur, though in much smaller increments than during fall. Almost all flu continues to be 2009 H1N1.
Visits to doctors for influenza-like illness (ILI) in general were low between January 17, 2010 and February 13, 2010 (Reporting weeks 3, 4, 5 and 6) and were below the national baseline during all four weeks. ILI is also looked at by regions in the United States. While ILI was consistently low nationwide, during the four-week time period added to the latest estimates, certain regions of the United States reported ILI activity above their regional baselines between January 17, 2010 and February 13, 2010, indicating ongoing localized flu activity, almost all of it thought to be 2009 H1N1. No states reported widespread activity throughout this period, however, a few states continued to reported regional flu activity; again an indication of ongoing localized 2009 H1N1 outbreaks. The proportion of deaths attributed to pneumonia and influenza (P&I) based on the 122 Cities Report was above the epidemic threshold from January 17 – January 30, 2010 (Reporting weeks 3 and 4) and then fell to below the epidemic threshold for January 31 – February 13 (Reporting weeks 5 and 6).
While activity so far this season peaked in October and then declined quickly to below baseline levels in January, and even further into February, there are still uncertainties surrounding the rest of this flu season, including the possibility of increases in circulation of seasonal influenza viruses and increases in circulation of 2009 H1N1 viruses. Flu activity – caused by either 2009 H1N1 or seasonal flu viruses – may rise and fall, but is expected to continue for several more weeks. During some seasons, flu activity can last into May. Also, in past pandemics, flu activity has occurred in waves and it’s possible that the United States could experience another wave of flu activity in the winter or spring of 2010, in addition to ongoing localized outbreaks. In addition, sporadic cases of influenza may also be detected in the summer.
The data by age provided in the updated estimates continues to confirm that people younger than 65 years of age are more severely affected by this disease relative to people 65 and older compared with seasonal flu. With seasonal influenza, about 60 percent of seasonal flu-related hospitalizations and 90 percent of flu-related deaths occur in people 65 years and older. With 2009 H1N1, approximately 90% of estimated hospitalizations and 87% of estimated deaths from April through February 13, 2009 occurred in people younger than 65 years old. CDC is continuing to recommend vaccination against 2009 H1N1 at this time for all people 6 months and older, including those people 65 years of age and older because severe illness and deaths have occurred in this age group.
As of February 13, 2010, approximately 86 million people had received 97 million doses of 2009 H1N1 vaccine. When the numbers of people vaccinated against 2009 H1N1 is combined with the number of people previously infected with 2009 H1N1, a significant number of people in the United States likely have immunity to the 2009 H1N1 virus. However, with a population of more than 300 million in this country, a substantial number of people likely remain susceptible to 2009 H1N1, which continues to circulate at this time. Ongoing vaccination of people with certain health conditions is particularly important because most cases of serious 2009 H1N1 illness (e.g., hospitalizations) have occurred in people with underlying medical conditions. (See “2009 H1N1 Flu: Underlying Health Conditions among Hospitalized Adults and Children.”) Health conditions that increase the risk of being hospitalized from 2009 H1N1 include lung disease like asthma or chronic pulmonary disease (COPD), diabetes, heart, or neurologic disease and pregnancy. In addition, minority populations have been harder-hit by the 2009 H1N1 pandemic than non-minority groups (See “Information on 2009 H1N1 impact by Race and Ethnicity.)”There also is growing evidence to support early concerns that people who are morbidly obese are at greater risk of serious 2009 H1N1 complications.
This methodology and the resulting estimates continue to underscore the substantial under-reporting that occurs when laboratory-confirmed outcomes are the sole method used to capture hospitalizations and deaths. CDC has maintained since the beginning of this outbreak that laboratory-confirmed data on hospitalizations and deaths reported to CDC is an underestimation of the true number that have occurred because of incomplete testing, inaccurate test results, or diagnosis that attribute hospitalizations and deaths to other causes, for example, secondary complications to influenza. (Information about surveillance and reporting for 2009 H1N1 is available at Questions and Answers: Monitoring Influenza Activity, Including 2009 H1N1.)
The estimates derived from this methodology provide the public, public health officials and policy makers a sense of the health impact of the 2009 H1N1 pandemic. While these numbers are an estimate, CDC feels that they present a fuller picture of the burden of 2009 H1N1 disease on the United States.
CDC will continue to use weekly data from systems that comprise the National Influenza Surveillance System to monitor geographic, temporal and virologic trends in influenza in the nation.
Graphics
The graphs below illustrate CDC’s estimates of cumulative 2009 H1N1 cases, hospitalizations and deaths in the United States by age group from April 2009 -February 13, 2010. The vertical black lines represent the range in 2009 H1N1 estimates for each time period. To see the tables associated with the earlier time periods for which CDC provided estimates, please see the April 2009 – January 16, 2010, the April – December 12, 2009 estimates, the April – November 14, 2009 estimates, and the April – October 17, 2009 estimates.
Graph A provides a summary illustration of the various estimates for 2009 H1N1 cases, made over time.
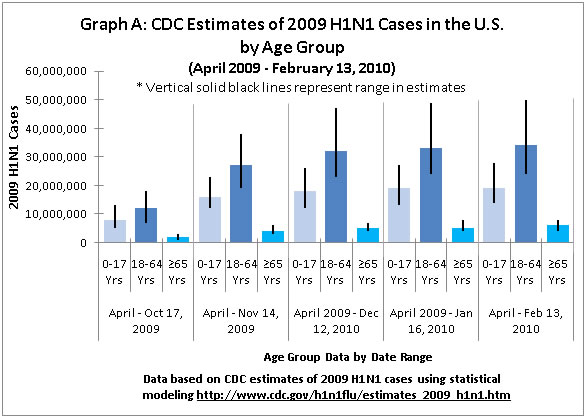
Graph A shows the cumulative estimated 2009 H1N1 cases by age group (0-17 years old, 18-64 years old, and 65 years and older) in the United States for each of the time periods that CDC provided case estimates and illustrates that people in the 18-64 years age group were most heavily impacted by 2009 H1N1 disease followed by people in the 0-17 years age group. People 65 years of age and older were relatively less affected by 2009 H1N1 illness.
Graph B below shows the total cumulative 2009 H1N1 cases (across all age groups) reported for each of the time periods that CDC provided case estimates.
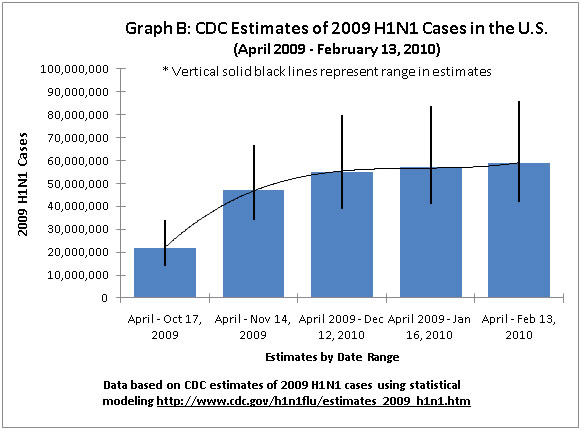
The curved black line in Graph B depicts the increase in 2009 H1N1 cases per the midpoint value of the estimates for each reporting period for which CDC provided 2009 H1N1 case estimates. The curved line in Graph B shows that the greatest increase in 2009 H1N1 cases occurred between October 17, 2009 and November 14, 2009, which correlates with the peak of the fall-winter wave of 2009 H1N1 activity in the United States.
Graphs C and D below display estimates of 2009 H1N1 related hospitalizations in the United States.
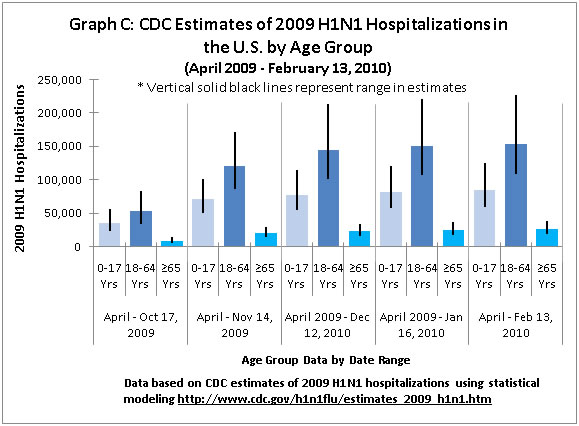
Graph C shows cumulative estimated 2009 H1N1 hospitalizations by age group (0-17 years old, 18-64 years old, and 65 years and older) in the United States for each of the time periods that CDC provided estimates of hospitalizations, and illustrates, again, that people 18-64 years of age were most impacted by serious illness (including hospitalizations), followed by people in the 0-17 years old age group. Again, people 65 and older were relatively less affected by 2009 H1N1 hospitalizations than people in other age groups.
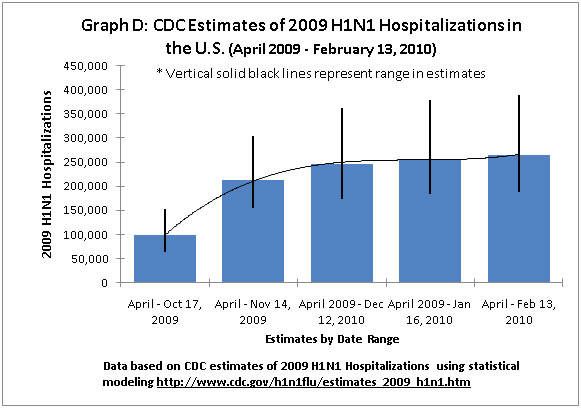
Graph D shows the total cumulative 2009 H1N1 hospitalizations reported for each of the time periods that CDC provided estimates of hospitalizations. The curved line in Graph D depicts the increase in 2009 H1N1 hospitalizations per the midpoint value of the estimates of each time period for which CDC provided estimates of hospitalizations. The curved line in Graph D shows that the greatest increase in 2009 H1N1 hospitalizations occurred between October 17, 2009 and November 14, 2009.
Graphs E and F below display estimates related to 2009 H1N1 deaths in the United States.
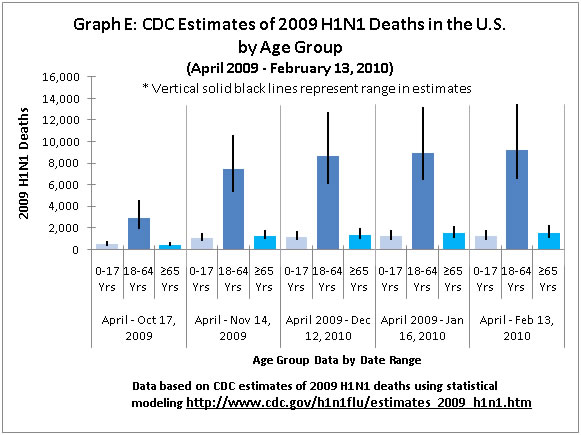
Graph E shows the cumulative estimated 2009 H1N1 deaths by age group (0-17 years old, 18-64 years old, and 65 years and older) in the United States for each of the time periods that CDC provided estimates of deaths and illustrates, again, that people in the 18-64 years age group were relatively more affected by 2009 H1N1 related deaths than people in other age groups.
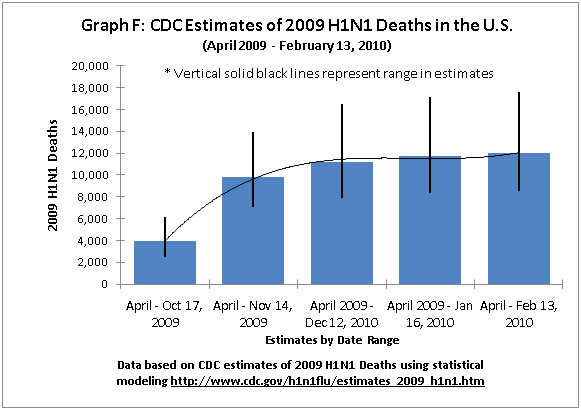
Graph F shows the total cumulative 2009 H1N1 deaths reported for each of the time periods that CDC provided estimates of deaths. The curved line in Graph F depicts the increase in 2009 H1N1 deaths per the mid-point value of the estimations for each reporting period for which CDC provided estimates of deaths. The curved line in Graph F shows that the greatest increase in 2009 H1N1 deaths occurred between October 17, 2009 and November 14, 2009.
Method to Estimate 2009 H1N1 Cases, Hospitalizations and Deaths
CDC has developed a method to provide an estimated range of the total number of 2009 H1N1 cases, hospitalizations and deaths in the United States since April, 2009, as well as a breakdown of these estimates by age groups. This method uses data on influenza-associated hospitalizations collected through CDC’s Emerging Infections Program (EIP), which conducts surveillance for laboratory-confirmed influenza-related hospitalizations in children and adults in 62 counties covering 13 metropolitan areas of 10 states. To determine an estimated number of 2009 H1N1 hospitalizations nationwide, the EIP hospitalization data are extrapolated to the entire U.S. population and then corrected for factors that may result in under-reporting using a multiplier from “Estimates of the Prevalence of Pandemic (H1N1) 2009, United States, April–July 2009.” The lower and upper hospitalization estimates also are calculated using the EIP hospitalization data. The national hospitalization estimates are then used to calculate deaths and cases. Deaths are calculated by using the proportion of laboratory-confirmed deaths to hospitalizations reported through CDC’s web-based Aggregate Hospitalization and Death Reporting Activity (AHDRA). Cases are estimated using multipliers derived from “Estimates of the Prevalence of Pandemic (H1N1) 2009, United States, April–July 2009.” The lower and upper end of the ranges for deaths and cases are derived from the lower and upper hospitalization estimates. The methods used to estimate impact may be modified as more information becomes available. More information about this methodology is available.
Throughout the remainder of the 2009 H1N1 pandemic CDC will update the range of estimated 2009 H1N1 cases, hospitalizations and deaths every three or four weeks. While EIP data is reported weekly during influenza season, because the system is based on reviews of patients medical charts there are sometimes delays in reporting and it can take some time for all the data to fill in. CDC will continue to provide weekly reports of influenza activity each Friday in FluView and will update the 2009 H1N1 Situation Update each Friday as well.
The estimated ranges of cases, hospitalizations and deaths generated by this method provide a sense of scale in terms of the burden of disease caused by 2009 H1N1. It may never be possible to validate the accuracy of these figures. The true number of cases, hospitalizations and deaths may lie within the range provided or it’s also possible that it may lie outside the range. The underlying assumption in this method is that the level of influenza activity (based on hospitalization rates) in EIP sites matches the level of influenza like illness (ILI) activity across the states.
This methodology is not a predictive tool and cannot be used to forecast the number of cases, hospitalizations and deaths that will occur going forward over the course of the pandemic because they are based on actual surveillance data.
Background Emerging Infections Program
The Emerging Infections Program (EIP) Influenza Project conducts surveillance for laboratory-confirmed influenza-related hospitalizations in children and adults in 62 counties covering 13 metropolitan areas of 10 states. (This includes San Francisco, CA; Denver, CO; New Haven, CT; Atlanta, GA; Baltimore, MD; Minneapolis/St. Paul, MN; Albuquerque, NM; Santa Fe, NM, Las Cruces, NM; Albany, NY; Rochester, NY; Portland, OR; and Nashville, TN.) Cases are identified by reviewing hospital laboratory and admission databases and infection control logs for children and adults with a documented positive influenza test conducted as a part of routine patient care. EIP estimated hospitalization rates are reported every week during the flu season. More information about the Emerging Infections Program is available.
Seasonal Influenza-Associated Hospitalizations in the United States
An average estimated 200,000 flu-related hospitalizations occur in the United States each year, with about 60 percent of these hospitalizations occurring in people 65 years and older.
Background: A study conducted by CDC and published in the Journal of American Medical Association (JAMA) in September 2004 provided information on the number of people in the United States that are hospitalized from seasonal influenza-related complications each year. The study concluded that, on average, more than 200,000 people in the United States are hospitalized each year for respiratory and heart conditions illnesses associated with seasonal influenza virus infections. The study looked at hospital records from 1979 to 2001. In 1979, there were 120,929 flu-related hospitalizations. The number was lower in some years after that, but there was an overall upward trend. During the 1990s, the average number of people hospitalized was more than 200,000 but individual seasons ranged from a low of 157,911 in 1990-91 to a high of 430,960 in 1997-98.
More information about seasonal flu-related hospitalizations is available.
Seasonal Influenza-Associated Deaths
Flu-associated mortality varies by season because flu seasons often fluctuate in length and severity. CDC estimates that about 36,000 people died of flu-related causes each year, on average, during the 1990s in the United States with 90 percent of these deaths occurring in people 65 years and older. This includes people dying from secondary complications of the flu.
Background: This estimate came from a 2003 Journal of the American Medical Association (JAMA) study, which looked at the 1990-91 through the 1998-99 flu seasons and is based on the number of people whose underlying cause of death on their death certificate was listed as a respiratory or circulatory disease. During these years, the number of estimated deaths ranged from 17,000 to 52,000. This number was corroborated in 2009, when a CDC-authored study was published in the journal Influenza and Other Respiratory Viruses. This study estimated seasonal flu-related deaths comparing different methods, including the methods used in the 2003 JAMA study but using more recent data. Results from this study showed that during this time period, 36,171 flu-related deaths occurred per year, on average. More information about how CDC estimates seasonal flu-related deaths is available.
Under-Counting of Flu-Related Deaths
CDC does not know exactly how many people die from seasonal flu each year. There are several reasons for this:- First, states are not required to report individual seasonal flu cases or deaths of people older than 18 years of age to CDC.
- Second, seasonal influenza is infrequently listed on death certificates of people who die from flu-related complications.
- Third, many seasonal flu-related deaths occur one or two weeks after a person’s initial infection, either because the person may develop a secondary bacterial co-infection (such as a staph infection) or because seasonal influenza can aggravate an existing chronic illness (such as congestive heart failure or chronic obstructive pulmonary disease).
- Also, most people who die from seasonal flu-related complications are not tested for flu, or they seek medical care later in their illness when seasonal influenza can no longer be detected from respiratory samples. Influenza tests are most likely to detect influenza if performed soon after onset of illness. In addition, some patients may be tested for influenza using rapid tests that are only moderately sensitive and result in some false-negative results.
- For these reasons, many flu-related deaths may not be recorded on death certificates.
These are some of the reasons that CDC and other public health agencies in the United States and other countries use statistical models to estimate the annual number of seasonal flu-related deaths. (Flu deaths in children were made a nationally notifiable condition in 2004, and since then, states have reported flu-related child deaths in the United States through the Influenza Associated Pediatric Mortality Surveillance System).
Get email updates
To receive weekly email updates about this site, enter your email address:
Contact Us:
- Centers for Disease Control and Prevention
1600 Clifton Rd
Atlanta, GA 30333 - 800-CDC-INFO
(800-232-4636)
TTY: (888) 232-6348 - Contact CDC-INFO