Novel H1N1 Flu Situation Update
August 7, 2009, 11:00 AM ET
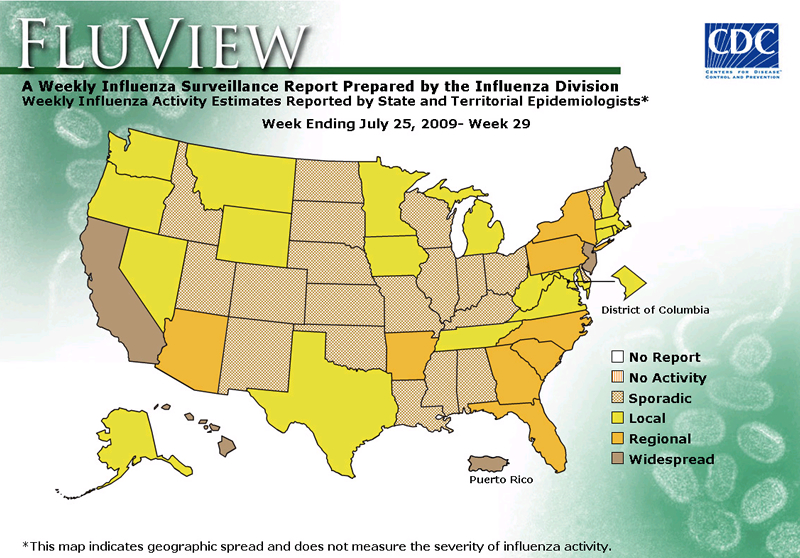
Map: Weekly Influenza Activity Estimates Reported by State and Territorial Epidemiologists
(Activity levels indicate geographic spread of both seasonal and novel influenza A [H1N1] viruses)
(Posted July 31, 2009, 1:30 PM ET, for Week Ending July 25, 2009)
For more details about the data in the map above, see the FluView Surveillance Report for the week ending July 25, 2009. For information about how this map is updated, see Questions & Answers About CDC's Online Reporting.
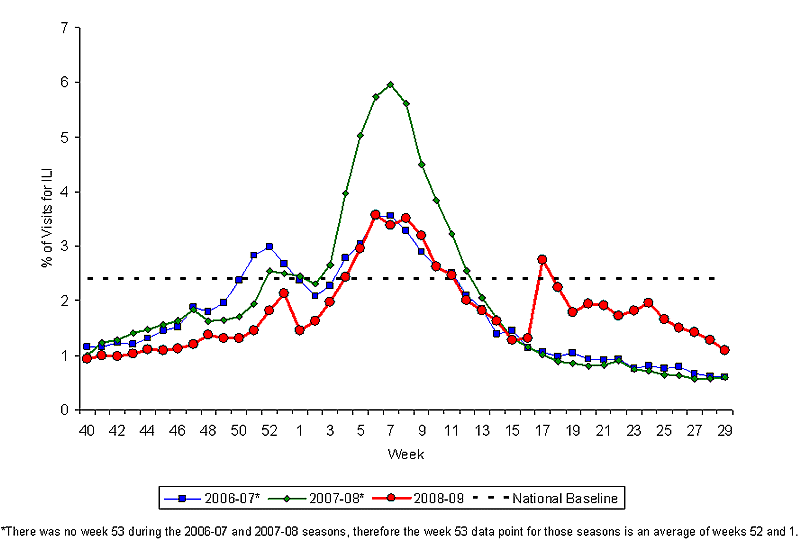
Percentage of Visits for Influenza-like Illness (ILI) Reported by the U.S. Outpatient Influenza-like Illness Surveillance Network (ILINet), National Summary 2008-2009 and Previous Two Seasons
(Posted July 31, 2009, 1:30 PM ET, for Week Ending July 25, 2009)

Reporting States and Territories* |
Hospitalized Cases |
Deaths |
|
|---|---|---|---|
| 50 | 6,506 | 436 | |
*Includes the District of Columbia, American Samoa, Guam, Puerto Rico and the U.S. Virgin Islands. The number of hospitalized novel H1N1 cases and deaths presented in this table are an aggregate CDC discontinued reporting of individual confirmed and probable cases of novel H1N1 infection on International Human Cases of H1N1 Flu Infection |
|||
