2009 H1N1 Influenza Vaccine Supply Status
November 23, 2009, 5:30 PM ET
| Project Areas* | Total Doses Allocated** as of 11/20/09 |
Total Doses Ordered as of 11/20/09 |
Total Doses Shipped*** as of 11/20/09 |
|---|---|---|---|
| Alabama | 822,400 | 720,800 | 699,600 |
| Alaska | 131,000 | 131,000 | 117,900 |
| American Samoa | 16,000 | 2000 | 2000 |
| Arizona | 1,092,300 | 1,058,900 | 1,025,000 |
| Arkansas | 500,100 | 487,200 | 437,300 |
| California | 6,118,400 | 6,048,800 | 5,753,800 |
| Chicago | 525,200 | 525,200 | 470,700 |
| Colorado | 831,000 | 780,900 | 661,500 |
| Connecticut | 619,000 | 618,800 | 551,500 |
| Delaware | 159,200 | 158,500 | 130,300 |
| District of Columbia | 113,600 | 113,100 | 98,900 |
| Federal Worker Program1 | 266,500 | 217,300 | 190,700 |
| Florida | 3,089,900 | 2,727,400 | 2,538,600 |
| Georgia | 1,704,400 | 1,403,600 | 1,310,800 |
| Guam | 35,000 | 33,400 | 21,000 |
| Hawaii | 226,400 | 192,300 | 180,300 |
| Idaho | 271,500 | 271,500 | 243,800 |
| Illinois | 1,844,000 | 1,833,300 | 1,643,100 |
| Indiana | 1,134,700 | 1,134,600 | 1,071,300 |
| Iowa | 526,000 | 504,500 | 470,500 |
| Kansas | 490,900 | 420,400 | 394,100 |
| Kentucky | 752,900 | 685,900 | 590,100 |
| Louisiana | 768,300 | 681,300 | 635,100 |
| Maine | 235,500 | 234,900 | 210,100 |
| Marshall Islands | 16,000 | 2,500 | 2,500 |
| Maryland | 983,400 | 977,700 | 875,700 |
| Massachusetts | 1,145,500 | 1,145,500 | 1,019,600 |
| Michigan | 1,777,600 | 1,595,800 | 1,418,800 |
| Micronesia | 24,100 | 21,400 | 21,400 |
| Minnesota | 928,800 | 912,700 | 844,300 |
| Mississippi | 514,900 | 440,100 | 392,800 |
| Missouri | 1,026,100 | 939,400 | 871,100 |
| Montana | 175,400 | 157,700 | 154,100 |
| Nebraska | 317,800 | 316,600 | 297,900 |
| Nevada | 440,500 | 356,800 | 344,900 |
| New Hampshire | 235,800 | 228,700 | 206,600 |
| New Jersey | 1,543,600 | 1,414,800 | 1,168,400 |
| New Mexico | 350,400 | 278,100 | 269,600 |
| New York | 1,975,300 | 1,835,600 | 1,694,200 |
| New York City | 1,486,700 | 1,393,600 | 1,313,000 |
| North Carolina | 1,623,600 | 1,557,600 | 1,240,900 |
| North Dakota | 119,500 | 114,900 | 107,500 |
| Northern Mariana Islands | 20,700 | 19,800 | 18,100 |
| Ohio | 2,039,400 | 2,031,700 | 1,600,500 |
| Oklahoma | 635,600 | 569,200 | 517,800 |
| Oregon | 638,800 | 590,900 | 516,600 |
| Pennsylvania | 1,914,900 | 1,839,900 | 1,713,000 |
| Philadelphia | 274,600 | 242,800 | 233,700 |
| Puerto Rico | 727,800 | 351,000 | 342,700 |
| Republic of Palau | 9,000 | 7,400 | 7,400 |
| Rhode Island | 189,800 | 160,500 | 143,300 |
| South Carolina | 790,900 | 704,100 | 698,000 |
| South Dakota | 147,100 | 147,100 | 132,500 |
| Tennessee | 1,096,500 | 1,091,700 | 975,700 |
| Texas | 4,171,900 | 3,786,100 | 3,606,700 |
| Utah | 462,800 | 444,500 | 428,100 |
| Vermont | 118,100 | 118,100 | 106,300 |
| Virgin Islands | 25,800 | 12,300 | 10,200 |
| Virginia | 1,355,100 | 1,355,100 | 1,205,700 |
| Washington | 1,100,000 | 989,900 | 937,300 |
| West Virginia | 337,000 | 337,000 | 302,300 |
| Wisconsin | 1,002,000 | 989,500 | 938,300 |
| Wyoming | 101,300 | 89,200 | 79,900 |
|
1For more information, please visit: http://www.opm.gov/pandemic/memos/h1n1_20090930.asp |
|||
| GRAND TOTAL | 54,145,300 | 50,552,900 | 46,205,400 |
|
* Project areas reflect CDC Public Health Emergency Response (PHER) Grantees
** Doses allocated to project areas for ordering are those that are at the distribution depots and ready for project areas to order. ***There is a lag time between allocation, ordering, and shipment of doses as project areas place orders and those orders are processed and shipped. |
|||
For Planners: Vaccine Allocation and Distribution Q&A
For the Public: 2009 H1N1 Influenza Vaccine Q&A, Supply and Distribution
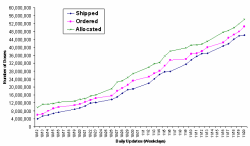
Graph and Table of 2009 H1N1 Influenza Vaccine Doses Allocated, Ordered, and Shipped in U.S.

View full-sized graph and table
Previous H1N1 Influenza Vaccine Supply Status Updates
Get email updates
To receive weekly email updates about this site, enter your email address:
Contact Us:
- Centers for Disease Control and Prevention
1600 Clifton Rd
Atlanta, GA 30333 - 800-CDC-INFO
(800-232-4636)
TTY: (888) 232-6348 - Contact CDC-INFO