2009 H1N1 Influenza Vaccine Supply Status
November 27, 2009, 4:30 PM ET
| Project Areas* | Total Doses Allocated** as of 11/25/09 |
Total Doses Ordered as of 11/25/09 |
Total Doses Shipped*** as of 11/25/09 |
|---|---|---|---|
| Alabama | 906200 | 770600 | 713600 |
| Alaska | 145400 | 145400 | 131000 |
| American Samoa | 18000 | 5000 | 2000 |
| Arizona | 1294000 | 1257100 | 1079900 |
| Arkansas | 561000 | 560900 | 500800 |
| California | 7254300 | 6884500 | 6155300 |
| Chicago | 585900 | 583000 | 504700 |
| Colorado | 984200 | 781100 | 781100 |
| Connecticut | 682000 | 682000 | 658100 |
| Delaware | 174700 | 171900 | 165,500 |
| District of Columbia | 125800 | 124900 | 113100 |
| Federal Worker Program1 | 311900 | 290800 | 242,000 |
| Florida | 3418400 | 3033900 | 2771700 |
| Georgia | 1878700 | 1,799,700 | 1,407,200 |
| Guam | 40300 | 33,400 | 21,000 |
| Hawaii | 266400 | 192600 | 192,600 |
| Idaho | 304100 | 271,500 | 271,500 |
| Illinois | 2058500 | 2032500 | 2,001,300 |
| Indiana | 1279100 | 1,225,100 | 1,222,700 |
| Iowa | 590200 | 504,500 | 504,500 |
| Kansas | 550800 | 495700 | 421,120 |
| Kentucky | 829700 | 746000 | 685900 |
| Louisiana | 862300 | 739,400 | 714,800 |
| Maine | 259200 | 258700 | 250,800 |
| Marshall Islands | 17900 | 2,500 | 2,500 |
| Maryland | 1084000 | 1031800 | 1020000 |
| Massachusetts | 1262300 | 1262300 | 1,169,600 |
| Michigan | 2004100 | 1782600 | 1626400 |
| Micronesia | 27400 | 21,400 | 21,400 |
| Minnesota | 1047000 | 971,400 | 971,400 |
| Mississippi | 577700 | 463100 | 462,700 |
| Missouri | 1152200 | 1068000 | 940,100 |
| Montana | 196200 | 196200 | 157,700 |
| Nebraska | 358200 | 350200 | 338,000 |
| Nevada | 521100 | 477,400 | 476300 |
| New Hampshire | 259500 | 232400 | 231,800 |
| New Jersey | 1740200 | 1526300 | 1414000 |
| New Mexico | 392800 | 353200 | 270000 |
| New York | 2227300 | 1943000 | 1,837,600 |
| New York City | 1676000 | 1654400 | 1,502,000 |
| North Carolina | 1789400 | 1734800 | 1555200 |
| North Dakota | 133300 | 132500 | 114,900 |
| Northern Mariana Islands | 23200 | 19,800 | 18,100 |
| Ohio | 2299200 | 2297300 | 2029900 |
| Oklahoma | 713200 | 704800 | 569200 |
| Oregon | 756400 | 673700 | 593,000 |
| Pennsylvania | 2189500 | 2168600 | 1839900 |
| Philadelphia | 308600 | 269600 | 242800 |
| Puerto Rico | 812200 | 371400 | 350900 |
| Republic of Palau | 9600 | 8,400 | 7,400 |
| Rhode Island | 208700 | 188,800 | 188,600 |
| South Carolina | 871500 | 837700 | 704,200 |
| South Dakota | 164300 | 164300 | 163,500 |
| Tennessee | 1208100 | 1,169,900 | 1168400 |
| Texas | 4688600 | 3930300 | 3,874,500 |
| Utah | 547600 | 532300 | 444,500 |
| Vermont | 131400 | 131400 | 118,100 |
| Virgin Islands | 27900 | 12,400 | 12400 |
| Virginia | 1493400 | 1493400 | 1,445,100 |
| Washington | 1303100 | 1201800 | 991,900 |
| West Virginia | 375800 | 337,000 | 337,000 |
| Wisconsin | 1129500 | 1125700 | 1,060,100 |
| Wyoming | 112600 | 112100 | 89,200 |
|
1For more information, please visit: http://www.opm.gov/pandemic/memos/h1n1_20090930.asp |
|||
| GRAND TOTAL | 61,222,100 | 56,544,400 | 51,872,520 |
|
* Project areas reflect CDC Public Health Emergency Response (PHER) Grantees
** Doses allocated to project areas for ordering are those that are at the distribution depots and ready for project areas to order. ***There is a lag time between allocation, ordering, and shipment of doses as project areas place orders and those orders are processed and shipped. View table data in XML format NEW Nov 27 |
|||
For Planners: Vaccine Allocation and Distribution Q&A
For the Public: 2009 H1N1 Influenza Vaccine Q&A, Supply and Distribution
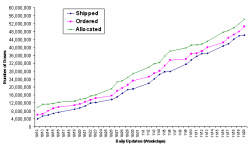
Graph and Table of 2009 H1N1 Influenza Vaccine Doses Allocated, Ordered, and Shipped in U.S.

View full-sized graph and table
Previous H1N1 Influenza Vaccine Supply Status Updates
Get email updates
To receive weekly email updates about this site, enter your email address:
Contact Us:
- Centers for Disease Control and Prevention
1600 Clifton Rd
Atlanta, GA 30333 - 800-CDC-INFO
(800-232-4636)
TTY: (888) 232-6348 - Contact CDC-INFO