Error processing SSI file

Graph and Table of 2009 H1N1 Influenza Vaccine Doses
Allocated, Ordered, and Shipped in U.S.
Updated Januray 6, 2010, 2:00 PM ET

Graph. 2009 H1N1 Influenza Vaccine Doses Allocated, Ordered, and Shipped in U.S.
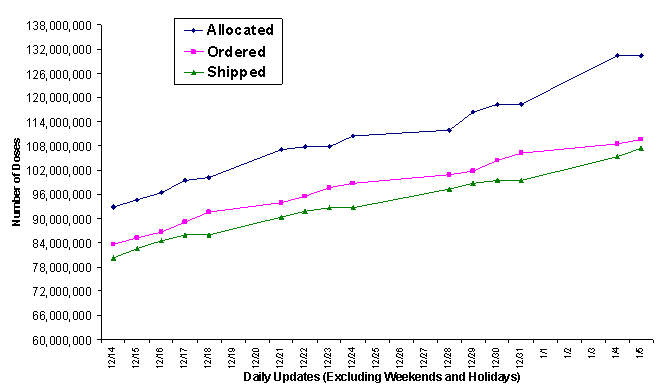
2009 Vaccine Doses Distributed, Ordered, and Allocated.

(NOTE: all data in graph can be found in table below.)

  • Allocated: Doses that are at the distribution depots and ready for states to order. Vaccine is allocated to each state in proportion to its population (pro rata)
  • Ordered: Doses requested by states as of 9 PM ET for shipment to state-designated locations
  • Shipped: Doses sent as of 5 PM ET from the central distributor to state-designated locations
Table. 2009 H1N1 Influenza Vaccine Doses Allocated, Ordered, and Shipped in U.S.
Date Allocated Ordered Shipped
01/05/10 130,386,600
109,506,200
107,351,020
01/04/10 130,386,600
108,474,200
105,266,520
12/31/09 118,241,100 106,247,500 99,366,920
12/30/09 118,241,100 104,249,900 99,362,620
12/29/09 116,266,700 101,697,200 98,764,920
12/28/09 111,947,700 100,931,500 97,281,820
12/24/09 110,477,700 98,681,000 92,659,820
12/23/09 107,786,500 97,584,000 92,659,820
12/22/09 107,786,500 95,514,300 91,863,720
12/21/09 107,156,700 93,940,500 90,384,920
12/18/09 100,082,700
91,630,300
85,988,420
12/17/09 99,439,500
89,187,200
85,980,220
12/16/09 96,385,200
86,710,200
84,493,120
12/15/09 94,628,100
85,298,200
82,617,120
12/14/09 92,883,100
83,656,200
76,355,920

Previous H1N1 Influenza Vaccine Supply Graph Pages