Error processing SSI file

Graph and Table of 2009 H1N1 Influenza Vaccine Doses
Allocated, Ordered, and Shipped in U.S.
Updated November 12, 2009, 3:00 PM ET

Graph. 2009 H1N1 Influenza Vaccine Doses Allocated, Ordered, and Shipped in U.S.
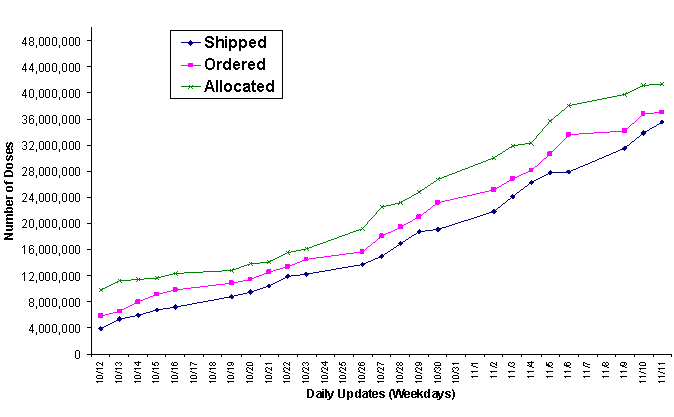
2009 Vaccine Doses Distributed, Ordered, and Allocated.

(NOTE: all data in graph can be found in table below.)

  • Allocated: Doses that are at the distribution depots and ready for states to order. Vaccine is allocated to each state in proportion to its population (pro rata)
  • Ordered: Doses requested by states as of 9 PM ET for shipment to state-designated locations
  • Shipped: Doses sent as of 5 PM ET from the central distributor to state-designated locations
Table. 2009 H1N1 Influenza Vaccine Doses Allocated, Ordered, and Shipped in U.S.
Date Allocated Ordered Shipped
11/11/09 41,297,100
36,983,500
35,445,700
11/10/09 41,070,900
36,730,760
33,762,200
11/9/09 39,723,300
34,100,160
31,493,600
11/6/09 38,038,100 33,556,000 27,812,200
11/5/09 35,618,800 30,643,800 27,727,600
11/4/09 32,329,600 28,036,300 26,248,100
11/3/09 31,839,200 26,833,900 24,119,600
11/2/09 30,033,800 25,159,000 21,849,500
10/30/09 26,686,400 23,164,300 19,062,600
10/29/09 24,828,500 21,057,200 18,689,700
10/28/09 23,160,700 19,443,600 16,870,000
10/27/09 22,438,400 17,995,400 14,960,000
10/26/09 19,174,600 15,610,600 13,740,600
10/23/09 16,081,100 14,440,800 12,252,200
10/22/09 15,512,000 13,397,400 11,918,900
10/21/09 14,070,900 12,533,700 10,363,600
10/20/09 13,797,700 11,384,900 9,430,000
10/19/09 12,837,600 10,808,200 8,826,600
10/16/09 12,368,700 9,800,100 7,207,800
10/15/09 11,653,700 9,175,900 6,734,600
10/14/09 11,422,900 7,971,800 5,885,900
10/13/09 11,229,600 6,479,300 5,368,000
10/12/09 9,772,600 5,846,000 3,921,900