How to Use the Data Quality (DQ) Dashboard
An Interactive DQ Monitoring and Investigation Tool
DQ Dashboard Link (AMC password required): https://dashboards.syndromicsurveillance.org/app/dqDashboard
NSSP shares your commitment to improving data quality and advancing the tools used to monitor and investigate potential issues with data processing and data content.
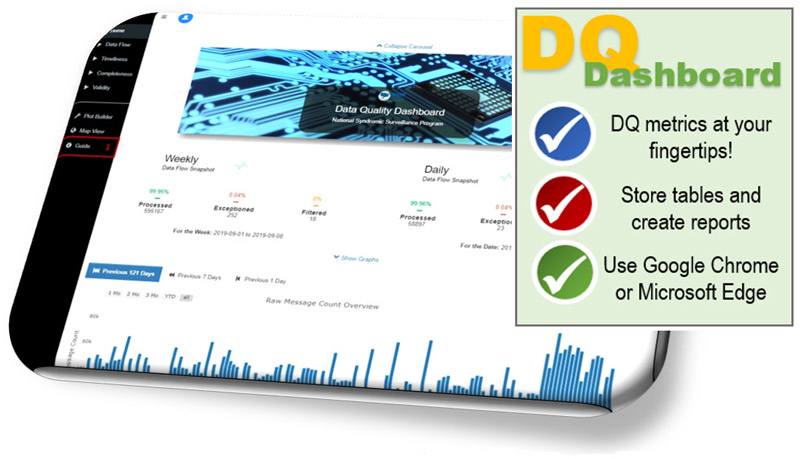
The NSSP DQ Dashboard is one more tool that’s been added to the site administrator’s NSSP Data Quality toolbox. This multifunctional tool is designed to give you an at-a-glance view of the “health” of your data and to identify where you need to dive deeper to resolve data quality issues. This is troubleshooting on the front line. NSSP puts DQ metrics at your fingertips!

NSSP DQ Toolbox for Site Administrators
• Detailed Excel DQ reports on data completeness, timeliness, and validity—delivered monthly
• Data-Quality-on-Demand (DQOD) SAS tool provides self-service delivery of detailed Excel DQ reports—you control delivery
• Executive-level report highlighting DQ metrics—delivered quarterly
• Site Summary Processing emails provide alerts about data processing and potential issues with end-to-end data flow—delivered daily
• Email alerts when active facilities are not sending data (30-, 60-, and 90-day alerts)
Use the NSSP DQ Dashboard to get a pulse read of the general health of your data flow and data content
The NSSP DQ Dashboard can help you identify and resolve potential issues in data being submitted by vendor or facility partners. If a facility experiences network problems or a vendor updates software that affects the content of the feed, your team needs to know how this affects routine and emergency surveillance activities.
Share reports. Collaborate on solutions.
Information is power. The DQ Dashboard provides download capability that lets you store tables and graphs and create reports. Share reports with your vendor and facility partners to let them know how they are doing. Use the reports to encourage and facilitate collaboration when troubleshooting and correcting issues.
The dashboard was introduced during the September NSSP Community of Practice monthly meeting. To view the webinar, visit the Knowledge Repository.
