Kansas Uses a Novel Approach to Assess Injuries to Agricultural Workers
Environmental Health

Farmers and their family members are at high risk for injury, death, and illness, due to risks such as exposure to pesticides and use of tractors, farming equipment, and other machinery. In Kansas, being able to rely on a standardized way to gather data on agricultural injuries eases the burden on the state’s 100 health departments—many of which have few employees. An analyst at the Kansas Department of Health and Environment (KDHE) used tools from CDC’s National Syndromic Surveillance Program (NSSP) to develop a pre-designed query for data collection that could be easily shared with health departments across the state.
In designing the query, the analyst realized the need to collect multiple types of data to ensure an accurate understanding of how agricultural injuries affect Kansans. As a result, KDHE combines data on the chief complaint of an agricultural worker, which medical facility they visit, and their diagnosis at discharge. Combining these data as part of syndromic surveillance provides a more accurate picture of the extent of injuries. Funding from the NSSP supports the use of syndromic surveillance in improving the nation’s public health.
Public Health Problem
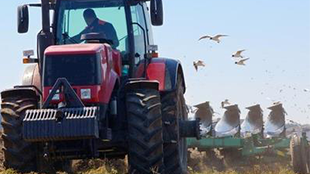
Agriculture can be a hazardous industry. Farmers, and oftentimes their family members, are at high risk for injuries, fatalities, and illness. Risks include exposure to pesticides on crop farms and use of tractors, farming equipment, and other machinery.
Each day in the United States, about 100 agricultural workers suffer a lost-work-time injury.1 In 2012, more than 90,000 people2 operated the 61,773 farms3 in Kansas. Another 29,881 were hired crop workers4 employed seasonally. The Kansas Department of Health and Environment (KDHE) wanted to gain a better understanding of how Kansans are affected by agriculture injuries.
Actions Taken

The state of Kansas has 100 health departments, half of which employ fewer than five employees. Rather than ask local health departments to survey each regional emergency department and hospital to characterize the extent of agriculture injuries, KDHE opted to use ESSENCE. The ESSENCE syndromic surveillance (SyS) software application collects prediagnostic data almost in real time. With ESSENCE, once a query has been written, sharing it is easy. A query written in Topeka can be shared widely across health departments. Because many of Kansas’s health departments are small, the need is greater for predesigned standard queries to ease the burden of data collection.
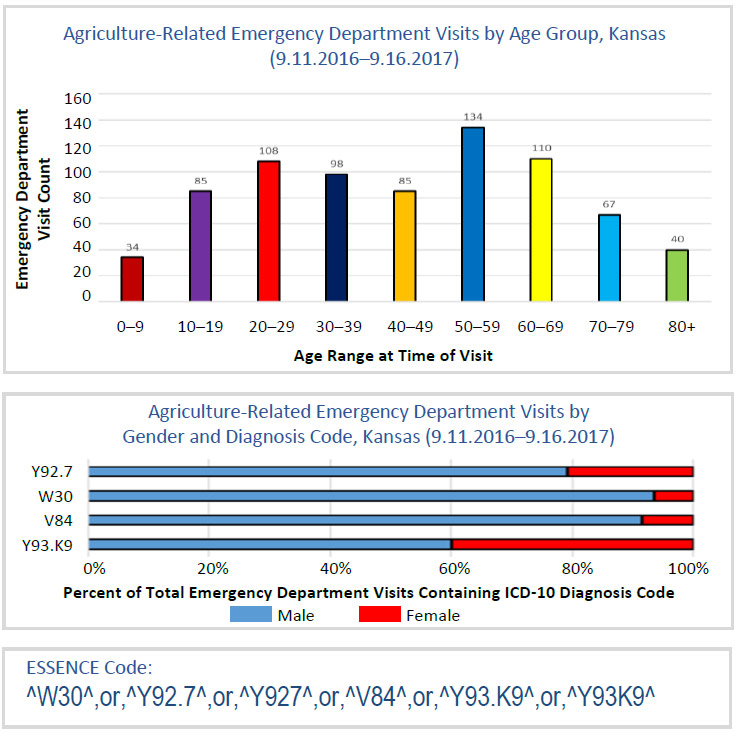
The analyst developing the query quickly discovered, however, that the literal text in the chief complaint field was insufficient for analysis. Having been raised on a farm, he knew from experience that farmers were not verbose in their emergency room complaints. As an alternative to capturing chief complaint, he identified agriculture injuries by using ICD-10 CM codes: W30 (contact with agricultural machinery), Y92.7 (farm as place of occurrence), V84 (occupant of special vehicle mainly used in agriculture), Y93.K9 (activity, other involving animal care). He also looked at data by facility of visit occurrence. Combined, he captured any visit to a Kansas emergency department regardless of patient residence, including visits by seasonal or migrant workers.
KDHE presented its results for characterizing agriculture injuries at the regional meeting of Western Kansas public health departments. Kansas holds regional public health meetings quarterly in six locations around the state. Meetings are attended by health department administrators, and KDHE analysts frequently use these meetings to report on SyS activities.
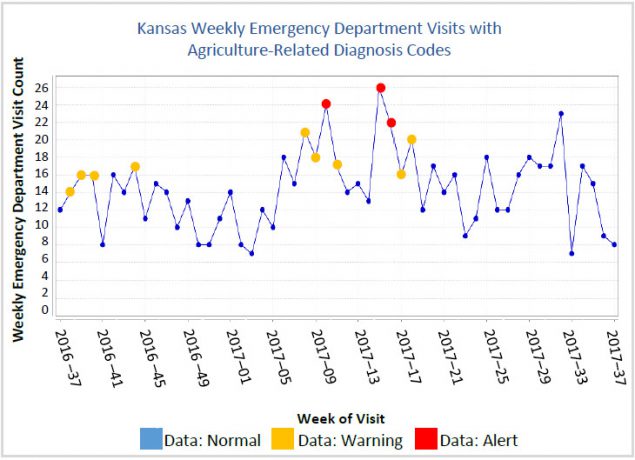
At this meeting, the KDHE analyst described how KDHE participates in the National Syndromic Surveillance Program and uses the BioSense Platform’s ESSENCE to conduct syndromic surveillance. “In ESSENCE, all of these charts are 100% interactive,” the analyst said. “I can break [data] out by patient residence, hospital location, race, sex, age, etc. ESSENCE runs alerting algorithms in the background, so the yellow dots are nearing a significant P-value, and the red dots show a highly significant P-value. All P values are calculated by one-sided tests to determine if counts exceed the number expected based on the previous 60 days. Any of these dots can also be selected to bring up the line-level patient data contributing to the count.”
Outcome
KDHE continues to monitor agriculture-related ED visits. Outreach has been made internally to KDHE’s Injury and Disability Prevention Programs for future direction and research on the subject. Additionally, information was made available to the Kansas Farm Bureau.
Lessons Learned
- Seize opportunities to share how you collect data with health administrators and policy makers. The basic message of health promotion should be clear. Explain why the issue is relevant and how people are affected. As data analysts and epidemiologists, always rely on the science to state your case while using language that decision makers will understand. Case studies and personal examples are effective and can stir emotions. Effective communication is essential to secure funding and to justify research.
- Know the population of interest. Be creative. Look beyond the chief complaint and discharge diagnosis fields.
- Test all of your ideas in the data environment, no matter how unlikely they are to yield results. Sometimes queries can have surprising results. With syndromic surveillance being such a new field, it takes a lot of trial and error to find new angles and uses for data.

1National Institute for Occupational Safety and Health (NIOSH). Agricultural Safety [Internet]. Atlanta (GA): CDC; 2017 Jun 6 [cited 2017 Sep 7]. Available from: https://www.cdc.gov/niosh/topics/aginjury/default.html
2US Department of Agriculture. 2012 Census of Agriculture: Kansas State and County Data. Vol 1 Geographic Area Series Part 16 AC-12-A-16 [Internet]. Washington (DC): USDA; 2014. Chapter 1, Table 43, Selected Operator Characteristics for Principal, Second, and Third Operator: 2012; [cited 2017 Sep 20]; p. 43. Available from: https://www.agcensus.usda.gov/Publications/2012/Full_Report/Volume_1,_Chapter_1_State_Le vel/Kansas/ksv1.pdf
3Ibid., Chapter 1, Table 1, Historical Highlights: 2012 and Earlier Census Years; [cited 2017 Sep 20]; p. 7.
4Ibid., Chapter 2. Table 7, Hired Farm Labor—Workers and Payroll: 2012, p. 323.
Contacts
Vital and Health Statistics Data Analysis
Bureau of Epidemiology and Public Health Informatics
KDHE.Syndromic@ks.gov
Bureau of Epidemiology and Public Health Informatics
Kansas Department of Health and Environment
Zach.Stein@ks.gov
Office of Public Health Data, Surveillance, and Technology
Division of Health Informatics and Surveillance
www.cdc.gov/nssp
This success story shows how NSSP
- Improves Data Representativeness
- Improves Data Quality, Timeliness, and Use
- Strengthens Syndromic Surveillance Practice
- Informs Public Health Action or Response
The findings and outcomes described in this syndromic success story are those of the authors and do not necessarily represent the official position of the National Syndromic Surveillance Program or the Centers for Disease Control and Prevention.
