Chemical Spill in Kansas: Importance of Sharing Information Across Sites

In October 2016, a distilling plant in Kansas accidentally mixed sulfuric acid and sodium hypochlorite, releasing a plume of chlorine gas. As the heavy plume spread across a nearby city of 11,000, residents experienced respiratory problems and sought medical care.
The Kansas Department of Health and Environment (KDHE) uses syndromic data to monitor exposures and health effects. By using an automated data flow, they provided helpful insights during the event without burdening healthcare providers, emergency responders, or hazmat teams. A syndromic surveillance epidemiologist tracked the increase in volume of emergency department visits and the hospitals experiencing the surge in demand for care. By focusing on patient chief complaints with broad terms like “chemical” and “chemical disaster,” he was able to characterize health effects. Patient complaints included asthma, coughing, wheezing, burning eyes, blurred vision, nausea or vomiting, difficulty breathing, shortness of breath, skin burns and blisters, and nose and throat irritation or burning. Within 2 hours of the spill, he began sharing findings with colleagues. He notified syndromic surveillance epidemiologists in Missouri and Nebraska and in Kansas City. Within that 2-hour span, at least 14 Kansas residents had entered a hospital in Missouri complaining of respiratory problems and seeking care.
The information and lessons learned from this experience paved the way for improved emergency response. Through funding from the National Syndromic Surveillance Program, syndromic surveillance is improving the nation’s public health.
Public Health Problem
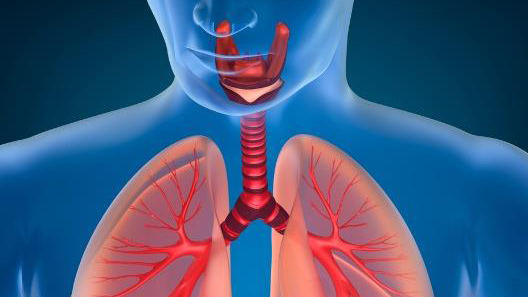
On October 21, 2016, at 8:02 am, a distilling plant in Kansas accidentally mixed sulfuric acid and sodium hypochlorite, releasing a plume of chlorine gas. The respiratory effects of breathing chlorine gas can be felt almost immediately and can be severe. Symptoms include cough, wheezing, difficulty breathing, and tightness in the chest.1,2 As the heavy plume spread across the nearby city of 11,000, residents experienced respiratory problems and sought medical care. One employee was taken to Hospital A, a participant in the Kansas Department of Health and Environment (KDHE) syndromic surveillance (SyS) network.
Actions Taken
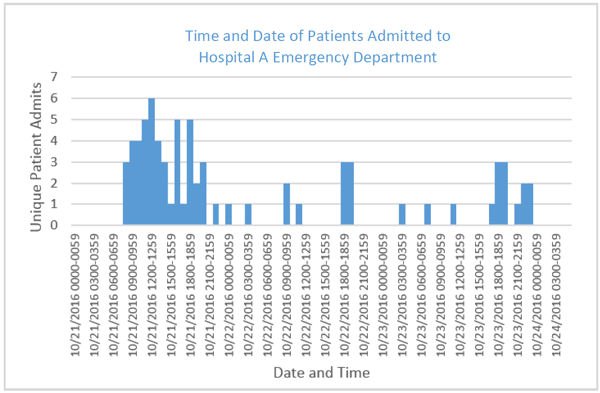
The KDHE SyS coordinator/epidemiologist noticed anomalies while analyzing data from Hospital A. On the day of the spill, visits increased nearly four-fold, far exceeding the expected daily count.
Initially, he searched chief complaints for broad terms including “chemical” and “chemical disaster.” Almost immediately, SyS data confirmed what he suspected. He developed queries based on the following criteria: chemical release, sulfuric acid, chlorine gas, plume, railyard. He also searched on health effects. As details filtered in, his queries became more specific. Within 2 hours of the spill, he began sharing findings with colleagues. He emailed SyS coordinators in Missouri and Nebraska. Shortly afterward, he notified surveillance epidemiologists in Kansas City. A Kansas epidemiologist contacted other Kansas emergency department (ED) facilities within the SyS network. An epidemiology SyS coordinator in Nebraska shared her surveillance queries. Findings showed at least 14 people had entered Hospital B in Missouri complaining of respiratory problems and seeking care—all within the 2-hour span. They listed non-Missouri ZIP codes under “County of residence.”
Hospital A went into triage mode. Of the unique visits to Hospital A’s ED, 82% of patients complained either of exposure to the chemical or of symptoms (skin burns and blisters, nose and throat irritation or burning, asthma, difficulty breathing, coughing, shortness of breath, wheezing, burning eyes, blurred vision, nausea, or vomiting).
The police, fire departments, Environmental Protection Agency, and Agency for Toxic Substances and Disease Registry were alerted. Lots of phone calls; lots of data sharing. Throughout the response, SyS contributed to situational awareness.
Because Kansas hospital EDs typically receive a large volume of visits, the epidemiologists restricted their syndrome definitions to direct mention of the exposure (e.g., facility name, town name, chlorine gas inhalation). This pull of information yielded 3 more patients who had mentioned the incident and 6 others whose chief complaint fields contained details congruent with a chemical spill. Diagnosis codes were queried, too, but without significant results.
Outcome
This success story demonstrates the value of syndromic surveillance. Hospital A, new to the Kansas SyS network and still testing its data feeds, had the largest number of patient visits relevant to the chemical spill based on search terms. The epidemiologists reviewing hospital data knew the demographics and recognized anomalies in visit counts. As patient counts increased, epidemiologists shared these data. On the day of the spill, Hospital A’s data feed showed:
- 49 patient complaints mentioned exposure and associated symptoms
- 16 patient complaints did not mention exposure; however, 6 non-exposure-related complaints contained respiratory distress
- 41 records did not contain data in any fields because the hospital’s data feeds were not in full production
A little more than 4 hours after the event began, the Kansas City health officials announced “all clear.”
The information KDHE gleaned from this experience will be used in an extensive post-event follow-up. Patients will be interviewed and assessed; random samples of households will be conducted to identify how many others might have been affected but chose not to seek treatment; hospitals will look at their preparation for dealing with a chemical emergency; guidance provided to the public will be assessed; and questions will be asked. Was the public given accurate guidance on what they should do? How can a chemical response be better managed and monitored?
Epidemiologists can draw reliable conclusions if they understand their data, even under less than ideal circumstances. KDHE continually works to hone its processes and build strong relationships. Because KDHE staff had established trusted working relationships within its network and with hospital staff, communications around this event were streamlined and effective, paving the way for improved emergency response.


Lessons Learned
- Syndromic surveillance produces sufficient numbers to detect events and improves situational awareness. How does one know if emergency preparation is adequate? Health officials at the Kansas Department of Health and Environment asked themselves the same question. “Several things need to be in sync,” one health official said. “As we get info, the challenge is to stay current. No matter how overwhelmed a hospital is, all patients are tracked from the time they walk in the door. Hospital A’s staff provided average daily numbers. Spotting a patient spike was key. Syndromic surveillance reflected what was happening in almost real time.”
- Collaboration is key. Energy is needed to bring people together and respond to any emergency. “Chemical emergencies are fast moving. We’re responsive.”
- Communication and protocols are essential. “We communicate. And we hope others will communicate with us.” The health official continued, “Having protocols in place is essential. We need to strengthen the lines of communication between all parties so that we, as a public health agency, are notified early. We now have an episode [chemical spill] and patient counts, and we can show how info comes together. We had limitations, but now we can go to our partners and say ‘we see the potential’ of syndromic surveillance.”
1 Centers for Disease Control and Prevention (CDC). Emergency Preparedness and Response. Facts about Chlorine Page [Internet]. Atlanta (GA); CDC; 2013 Apr 10 [cited 2017 Jan 27]. Available from: https://emergency.cdc.gov/agent/chlorine/basics/facts.asp
2 CDC. Toxic Substances Portal, Chlorine – ToxFAQs CAS #7782-50-5 [Fact Sheet]. Atlanta, GA: CDC; 2007 Sep [cited 2017 Jan 27]. Available from: https://www.atsdr.cdc.gov/toxfaqs/Index.asp#C
Contacts
Vital and Health Statistics Data Analysis
Bureau of Epidemiology and Public Health Informatics
Kansas Department of Health and Environment
KDHE.Syndromic@ks.gov
Office of Public Health Data, Surveillance, and Technology
Division of Health Informatics and Surveillance
www.cdc.gov/nssp
This success story shows how NSSP
- Improves Data Representativeness
- Improves Data Quality, Timeliness, and Use
- Strengthens Syndromic Surveillance Practice
- Informs Public Health Action or Response
The findings and outcomes described in this syndromic success story are those of the authors and do not necessarily represent the official position of the National Syndromic Surveillance Program or the Centers for Disease Control and Prevention.
