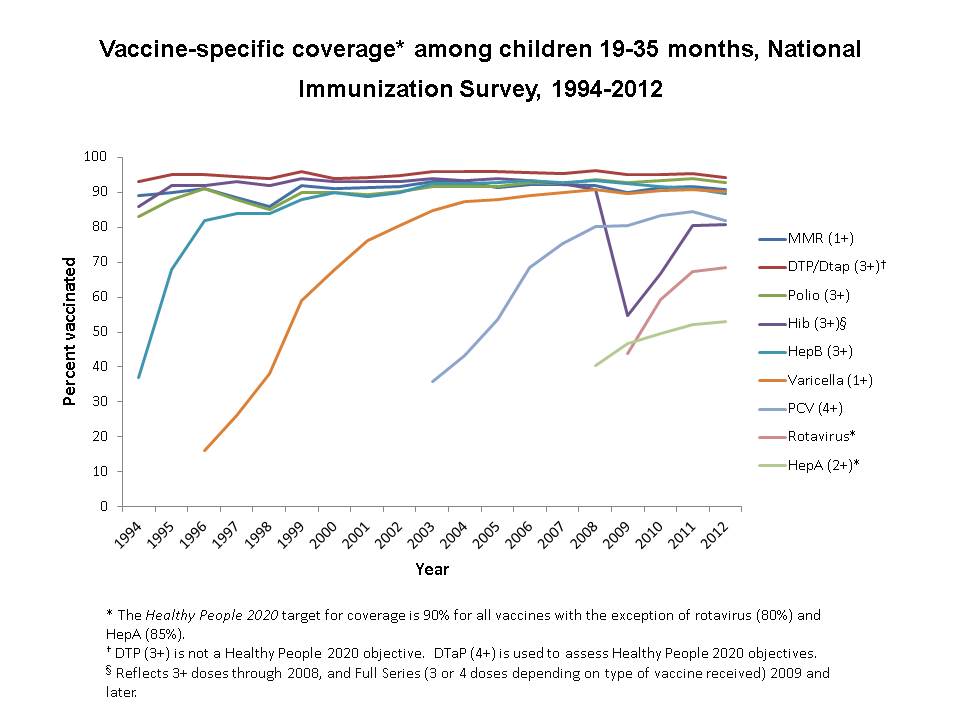
Figure Depicting Coverage with Individual Vaccines from the Inception of NIS, 1994 Through 2012
September 11, 2013: Content on this page kept for historical reasons.
Vaccine-specific coverage among children 19-35 months, National Immunization Survey, 1994-2012.

Data for this figure
| MMR (1+) | DTP/Dtap (3+)† | Polio (3+) | Hib (3+)§ | HepB (3+) | Varicella (1+) | PCV (4+) | Rotavirus* | HepA (2+)* | |
|---|---|---|---|---|---|---|---|---|---|
| 1994 | 89 | 93 | 83 | 86 | 37 | ||||
| 1995 | 90 | 95 | 88 | 92 | 68 | ||||
| 1996 | 91 | 95 | 91 | 92 | 82 | 16 | |||
| 1997 | 88.5 | 94.5 | 88 | 93 | 84 | 26 | |||
| 1998 | 86 | 94 | 85 | 92 | 84 | 38 | |||
| 1999 | 92 | 96 | 90 | 94 | 88 | 59 | |||
| 2000 | 91 | 94 | 90 | 93 | 90 | 68 | |||
| 2001 | 91.4 | 94.3 | 89.4 | 93 | 88.9 | 76.3 | |||
| 2002 | 91.6 | 94.9 | 90.2 | 93.1 | 89.9 | 80.6 | |||
| 2003 | 93 | 96 | 91.6 | 93.9 | 92.4 | 84.8 | 35.8 | ||
| 2004 | 93 | 95.9 | 91.6 | 93.5 | 92.4 | 87.5 | 43.4 | ||
| 2005 | 91.5 | 96.1 | 91.7 | 93.9 | 92.9 | 87.9 | 53.7 | ||
| 2006 | 92.3 | 95.8 | 92.8 | 93.4 | 93.3 | 89.2 | 68.4 | ||
| 2007 | 92.3 | 95.5 | 92.6 | 92.6 | 92.7 | 90 | 75.3 | ||
| 2008 | 92.1 | 96.2 | 93.6 | 90.9 | 93.5 | 90.7 | 80.1 | 40.4 | |
| 2009 | 90 | 95 | 92.8 | 54.8 | 92.4 | 89.6 | 80.4 | 43.9 | 46.6 |
| 2010 | 91.5 | 95 | 93.3 | 66.8 | 91.8 | 90.4 | 83.3 | 59.2 | 49.7 |
| 2011 | 91.6 | 95.5 | 93.9 | 80.4 | 91 | 90.8 | 84.4 | 67.3 | 52.2 |
| 2012 | 90.8 | 94.3 | 92.8 | 80.9 | 89.7 | 90.2 | 81.9 | 68.6 | 53 |