Adult Smoking in the US infographic
Adult Smoking in the US infographic
Vital Signs
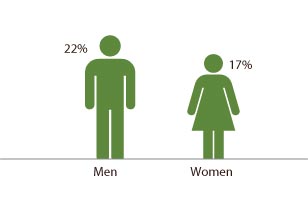
Statistics taken from the 2010 National Health Interview Survey showing the percentage of adults who smoke by sex
- 21.5% of men
- 17.3% of women
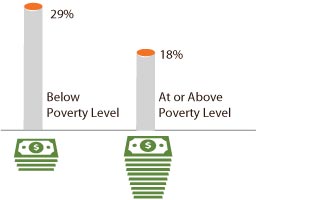
Statistics taken from the 2010 National Health Interview Survey showing the percentage of adults who smoke by poverty level
- 28.9% of adults below the poverty level
- 18.3% of adults at/above the poverty level
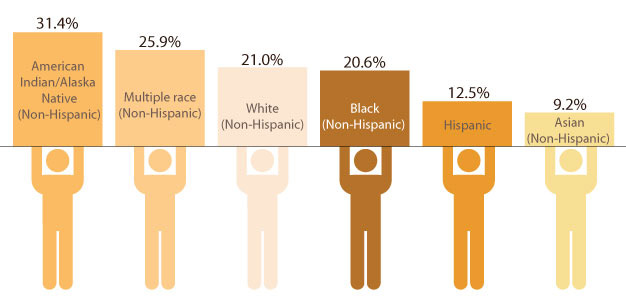
Statistics taken from the 2010 National Health Interview Survey showing the percentage of adults who smoke by racial/ethnic group
- 31.4% of American Indian/Alaska Native adults (non-Hispanic)
- 25.9% of multiple-race adults (non-Hispanic)
- 21.0% of white adults (non-Hispanic)
- 20.6% of black adults (non-Hispanic)
- 12.5% of Hispanic adults
- 9.2% of Asian adults (non-Hispanic)
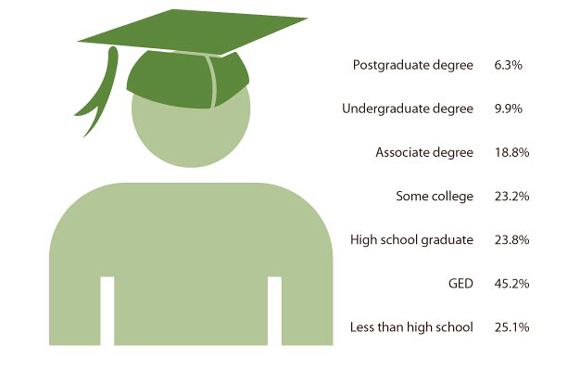
Statistics taken from the 2010 National Health Interview Survey showing the percentage of adults who smoke by education level. Note that education estimates are among individuals 25 years of age and older.
- 6.3% of adults with a postgraduate degree
- 9.9% of adults with an undergraduate degree
- 18.8% of adults with an associate’s degree
- 23.2% of adults with some college experience
- 23.8% of adults with a high school diploma
- 45.2% of adults with a GED certificate
- 25.1% of adults who have not completed high school
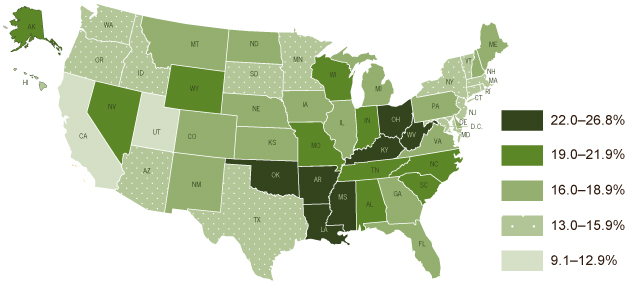
U.S. Map: Statistics taken from the 2010 Behavioral Risk Factor Surveillance System showing adult smoking prevalence by state
- 22.0 to 26.8% of adults in Arkansas, Kentucky, Louisiana, Mississippi, Ohio, Oklahoma, and West Virginia
- 19.0 to 21.9% of adults in Alabama, Alaska, Indiana, Missouri, Nevada, North Carolina, South Carolina, Tennessee, Wisconsin, and Wyoming
- 16.0 to 18.9% of adults in Colorado, Delaware, Florida, Georgia, Illinois, Iowa, Kansas, Maine, Michigan, Montana, Nebraska, New Hampshire, New Mexico, North Dakota, Pennsylvania, and Virginia
- 13.0 to 15.9% of adults in Arizona, Connecticut, District of Columbia, Hawaii, Idaho, Maryland, Massachusetts, Minnesota, New Jersey, New York, Oregon, Rhode Island, South Dakota, Texas, Vermont, and Washington
- 9.1 to 12.9% of adults in California and Utah
