Alcohol Poisoning Deaths infographic
Vital Signs
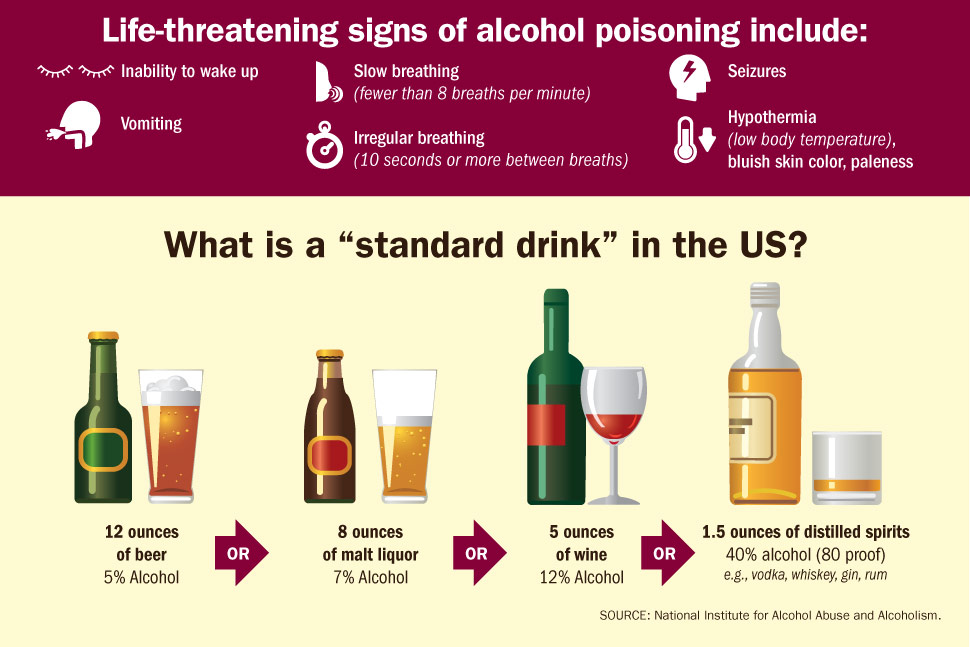
- Inability to wake up
- Vomiting
- Slow breathing (fewer than 8 breaths per minute)
- Irregular breathing (10 seconds or more between breaths)
- Seizures
- Hypothermia (low body temperature), bluish skin color, paleness
- 12 ounces of beer 5% Alcohol
- 8 ounces of malt liquor 7% Alcohol
- 5 ounces of wine 12% Alcohol
- 1.5 ounces of distilled spirits 40% alcohol (80 proof)
e.g., vodka, whiskey, gin, rum - SOURCE: National Institute for Alcohol Abuse and Alcoholism.
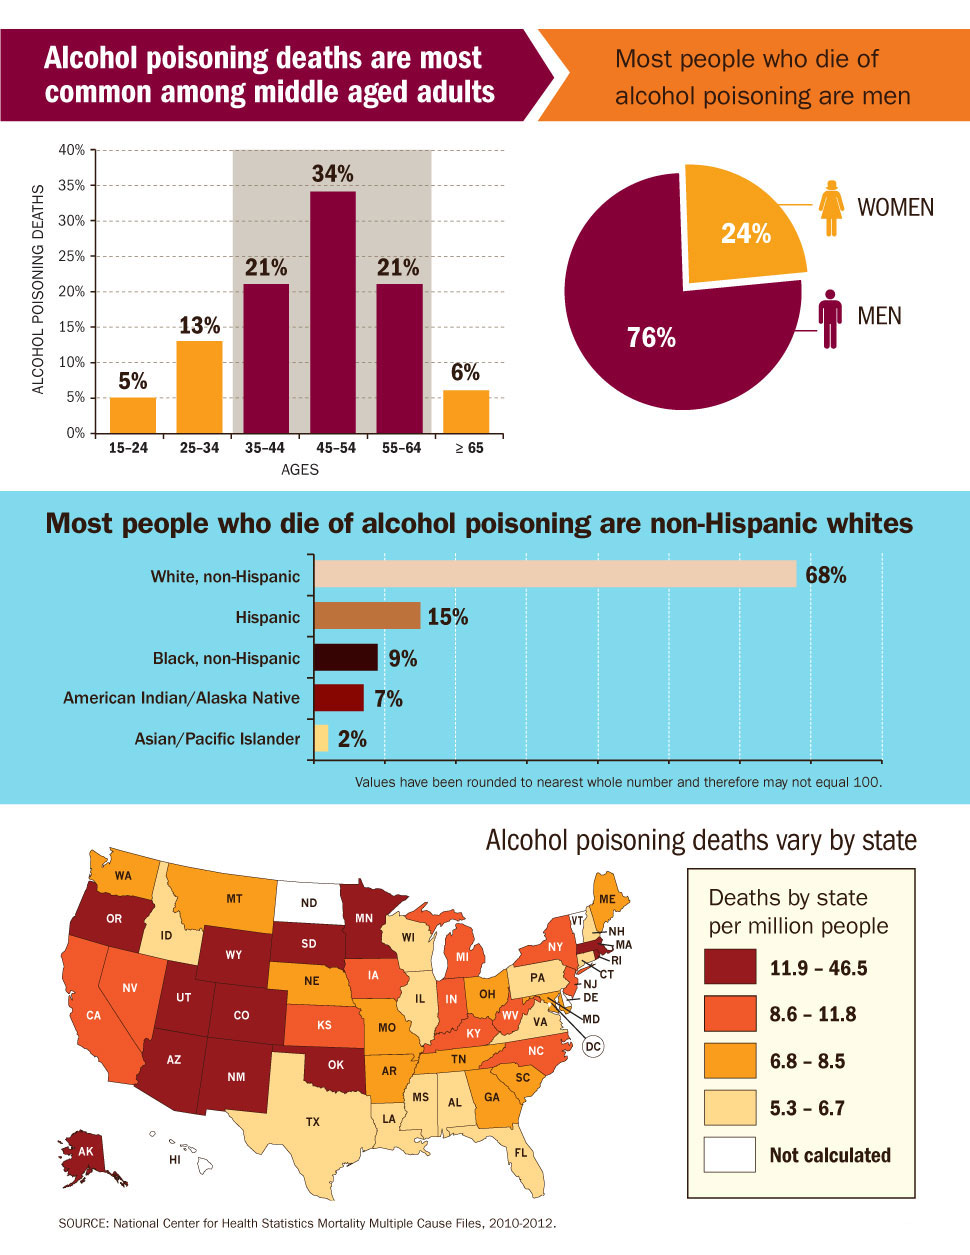
| % Alcohol Poisoning Deaths |
Ages |
|---|---|
| 5% | 15–24 |
| 13% | 25–34 |
| 21% | 35–44 |
| 34% | 45–54 |
| 21% | 55–64 |
| 6% | ≥65 |
- Men: 76%
- Women: 24%
- White, non-Hispanic: 68%
- Hispanic: 15%
- Black, non-Hispanic: 9%
- American Indian/Alaska Native: 7%
- Asian/Pacific Islander: 2%
Values have been rounded to nearest whole number and therefore may not equal 100.
Alcohol poisoning deaths rates* by state† – National Vital Statistics System, United States, 2010-2012
| State | Age-adjusted Rate§ |
|---|---|
| Quartile 1 (5.3–6.7 death rate) | |
| Alabama | 5.3 |
| Texas | 5.4 |
| Illinois | 5.6 |
| Virginia | 5.9 |
| Wisconsin | 6.0 |
| Idaho | 6.1 |
| Louisiana | 6.2 |
| Pennsylvania | 6.5 |
| Connecticut | 6.6 |
| Florida | 6.7 |
| Mississippi | 6.7 |
| New Hampshire | 6.7 |
| Quartile 2 (6.8–8.5 death rate) | |
| Ohio | 6.9 |
| South Carolina | 7.4 |
| Missouri | 7.7 |
| Tennessee | 7.8 |
| Georgia | 7.8 |
| Arkansas | 7.8 |
| Maryland | 7.8 |
| Washington | 8.1 |
| Maine | 8.1 |
| Nebraska | 8.1 |
| Montana | 8.5 |
| State | Age-adjusted Rate§ |
|---|---|
| Quartile 3 (8.6 – 11.8 death rate) | |
| Indiana | 8.6 |
| North Carolina | 8.6 |
| New York | 8.8 |
| Kentucky | 9.1 |
| Kansas | 9.6 |
| Iowa | 9.7 |
| Michigan | 9.7 |
| Nevada | 9.8 |
| New Jersey | 9.9 |
| California | 9.9 |
| West Virginia | 11.2 |
| Quartile 4 (11.9 – 46.5 death rate) | |
| Massachusetts | 11.9 |
| Oklahoma | 12.6 |
| Oregon | 12.7 |
| Colorado | 14.4 |
| Minnesota | 16.4 |
| Utah | 16.7 |
| South Dakota | 17.0 |
| Wyoming | 17.7 |
| Arizona | 18.7 |
| Rhode Island | 22.8 |
| New Mexico | 32.7 |
| Alaska | 46.5 |
*Alcohol poisoning deaths included those occurring among those aged ≥15 years in which alcohol poisoning was classified as the underlying (i.e. principal) cause of death based on International Classification of Diseases, 10th Revision (ICD-10) Codes: X45 (Accidental poisoning by and exposure to alcohol), Y15 (Poisoning by and exposure to alcohol, undetermined intent).
†The average annual number of alcohol poisoning deaths in Delaware, District of Columbia, Hawaii, North Dakota, and Vermont were <7, and therefore, did not meet standards of reliability and precision to calculate age-adjusted death rates.
§Alcohol poisoning death rates per 1,000,000 population for persons aged ≥15 years were age-adjusted to the 2000 U.S. Census standard population.


