
Vital Signs: Preventing 1 Million Heart Attacks and Strokes
Vital Signs: Preventing 1 Million Heart Attacks and Strokes
Middle-aged adults are being hard hit
| Fact Sheet | Estimate Type | |||||
| State | Overall Rate | Overall Count | Overall Rate per 100K (Count, thousands) | Estimated | ED Estimate Only | ED and Hosp. Estimate |
| Alabama | 1,652.4 | 347,908 | 1,652 (348) | * | * | * |
| Alaska | 822.7 | 20,123 | 823 (20) | * | * | |
| Arizona | 913.9 | 276,303 | 914 (276) | |||
| Arkansas | 1,366.7 | 177,330 | 1,367 (177) | |||
| California | 999.4 | 1,558,936 | 999 (1559) | |||
| Colorado | 785.9 | 172,022 | 786 (172) | * | * | |
| Connecticut | 950.4 | 161,671 | 950 (162) | |||
| Delaware | 1,000.5 | 45,250 | 1,001 (45) | * | * | * |
| District of Columbia | 2,048.2 | 49,077 | 2,048 (49) | |||
| Florida | 1,163.7 | 1,206,796 | 1,164 (1207) | |||
| Georgia | 1,351 | 543,542 | 1,351 (544) | |||
| Hawaii | 1,031.8 | 68,976 | 1,032 (69) | |||
| Idaho | 1,156 | 83,841 | 1,156 (84) | * | * | * |
| Illinois | 1,174.7 | 625,367 | 1,175 (625) | |||
| Indiana | 1,338.2 | 377,936 | 1,338 (378) | |||
| Iowa | 1,007.9 | 145,408 | 1,008 (145) | |||
| Kansas | 1,106.9 | 136,285 | 1,107 (136) | |||
| Kentucky | 1,510.3 | 291,616 | 1,510 (292) | |||
| Louisiana | 1,523.2 | 279,311 | 1,523 (279) | * | * | |
| Maine | 1,157.9 | 82,261 | 1,158 (82) | |||
| Maryland | 1,106.6 | 280,222 | 1,107 (280) | |||
| Massachusetts | 1,033.1 | 314,004 | 1,033 (314) | |||
| Michigan | 1,378.7 | 623,502 | 1,379 (624) | * | * | |
| Minnesota | 900.2 | 218,431 | 900 (218) | |||
| Mississippi | 1,520.7 | 185,010 | 1,521 (185) | * | * | |
| Missouri | 1,381.5 | 375,259 | 1,382 (375) | |||
| Montana | 849.4 | 43,767 | 849 (44) | |||
| Nebraska | 929.6 | 76,241 | 930 (76) | |||
| Nevada | 1,107.4 | 127,974 | 1,107 (128) | |||
| New Hampshire | 893.3 | 56,637 | 893 (57) | * | * | * |
| New Jersey | 1,108 | 434,183 | 1,108 (434) | |||
| New Mexico | 767.3 | 71522 | 767 (72) | * | * | |
| New York | 1,029.8 | 889,166 | 1,030 (889) | |||
| North Carolina | 1,303.2 | 586,676 | 1,303 (587) | |||
| North Dakota | 1,210 | 40,097 | 1,210 (40) | |||
| Ohio | 1,364 | 718,927 | 1,364 (719) | |||
| Oklahoma | 1,256.6 | 204,115 | 1,257 (204) | * | * | |
| Oregon | 942.3 | 180,299 | 942 (180) | * | * | |
| Pennsylvania | 1,331.7 | 820,636 | 1,332 (821) | * | * | |
| Rhode Island | 1,212.6 | 59,328 | 1,213 (59) | |||
| South Carolina | 1,326.7 | 298,828 | 1,327 (299) | |||
| South Dakota | 1,057.7 | 41,861 | 1,058 (42) | |||
| Tennessee | 1,551.6 | 452,616 | 1,552 (453) | |||
| Texas | 1,264.3 | 1,291,912 | 1,264 (1292) | |||
| Utah | 805.7 | 79,764 | 806 (80) | |||
| Vermont | 840.6 | 25,888 | 841 (26) | |||
| Virginia | 1,183.2 | 418,170 | 1,183 (418) | * | * | |
| Washington | 972.9 | 305,157 | 973 (305) | * | * | |
| West Virginia | 1,397.4 | 127,665 | 1,397 (128) | * | * | |
| Wisconsin | 1,025 | 270,907 | 1,025 (271) | |||
| Wyoming | 828.9 | 20,369 | 829 (20) | |||
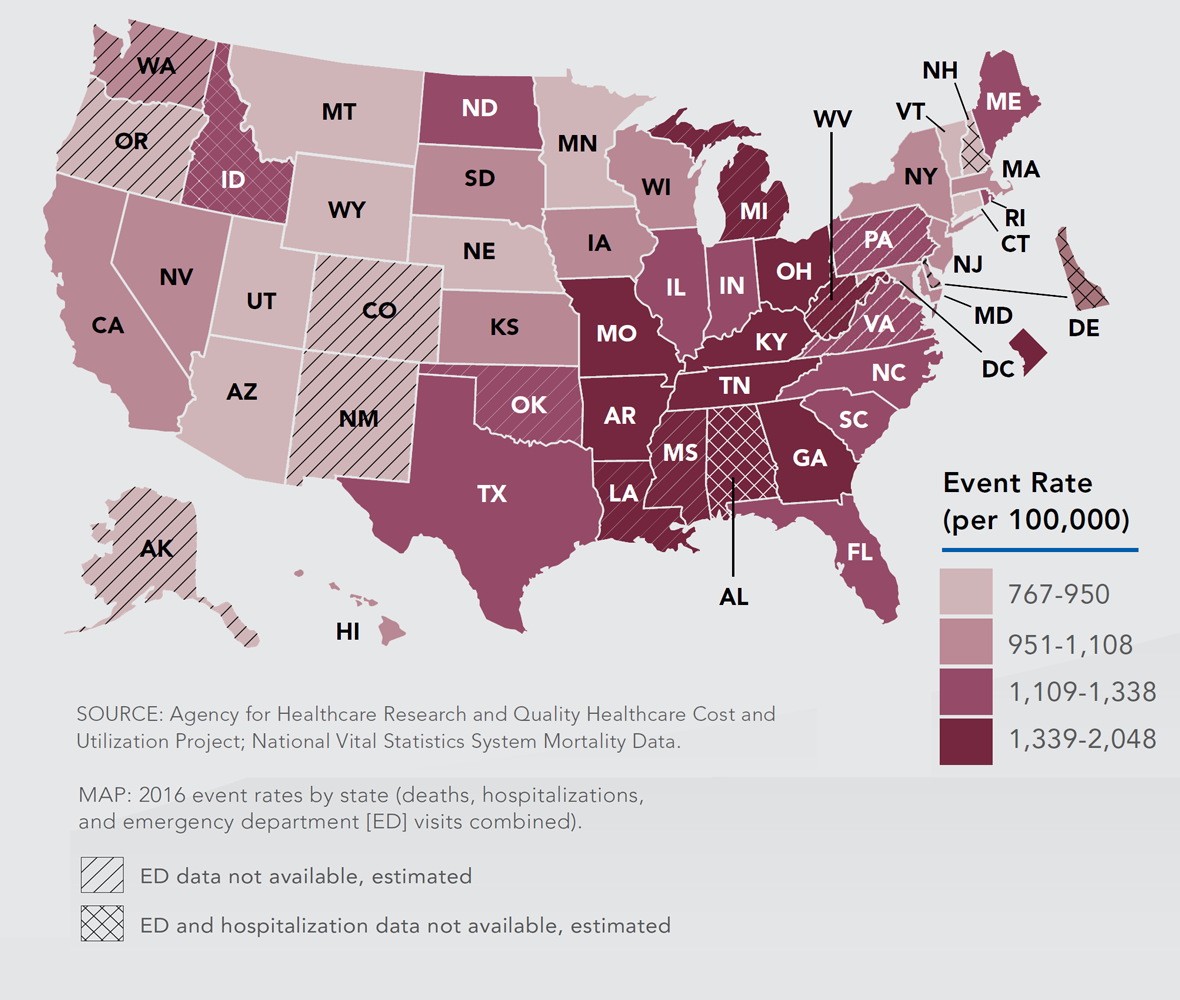
SOURCE: Agency for Healthcare Research and Quality Healthcare Cost and Utilization Project; National Vital Statistics System Mortality Data.
MAP: 2016 event rates by state (deaths, hospitalizations, and emergency department [ED] visits combined). SOURCE: Agency for Healthcare Research and Quality Healthcare Cost and Utilization Project; National Vital Statistics System Mortality Data