Tobacco Use, Smoking infographic
Vital Signs
Risks from Smoking
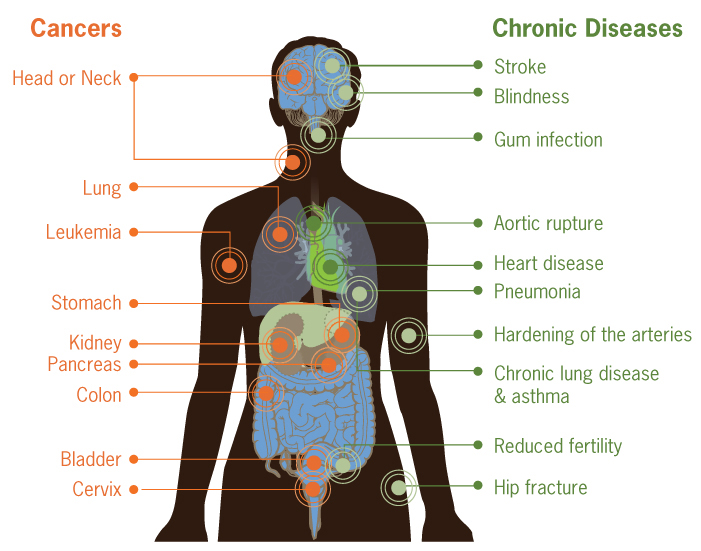
Smoking can damage every part of the body

This image is illustrates how smoking can damage every part of the body. The image show an outline of a human body. Internal organs are visible, and circles mark the locations where smoking causes damage. On the left side of the body, the following locations and organs are marked with circles to identify cancers caused by smoking: Head or neck, lung, stomach, kidney, pancreas, colon, cervix, and bladder. On the right side of the body, the following locations and organs are marked with circles to identify chronic diseases caused by smoking: stroke, blindness, gum infection, aortic rupture, heart disease, pneumonia, hardening of the arteries, chronic lung disease/asthma, reduced fertility, and hip fracture.
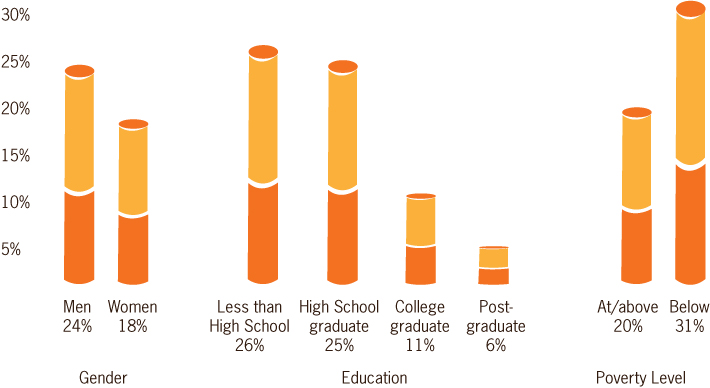
Some groups of people in the US smoke more than others.
Current smoking percentages by group

This graph displays current smoking percentages by group. Men 24%, women 18%, Less then high school education 26%, high school graduate 25%, college graduate 11%, post graduate 6%, at/above poverty level 20%, below poverty level 31%.

This image is a color-coded map of the United States that displays how smoking rates vary across the states. Less than 13% = California, Utah; 13+% to 16% = Washington, Idaho, Arizona, Maryland, Connecticut, New Hampshire, Rhode Island, Delaware, Massachusetts, District of Columbia, New Jersey, Hawaii; 16+% to 19% = Oregon, Montana, Colorado, New Mexico, North Dakota, South Dakota, Nebraska, Kansas, Texas, Minnesota, Iowa, Wisconsin, Illinois, Georgia, Florida, Virginia, New York, Connecticut, Vermont, Maine; 19+% to 22% = Nevada, Wyoming, Arkansas, Louisiana, Alabama, Tennessee, Michigan, Ohio, Pennsylvania, North Carolina, South Carolina; 23% to 26% = Oklahoma, Missouri, Mississippi, Kentucky, Indiana, West Virginia.
