Vital Signs: Illnesses on the rise
From mosquito, tick, and flea bites

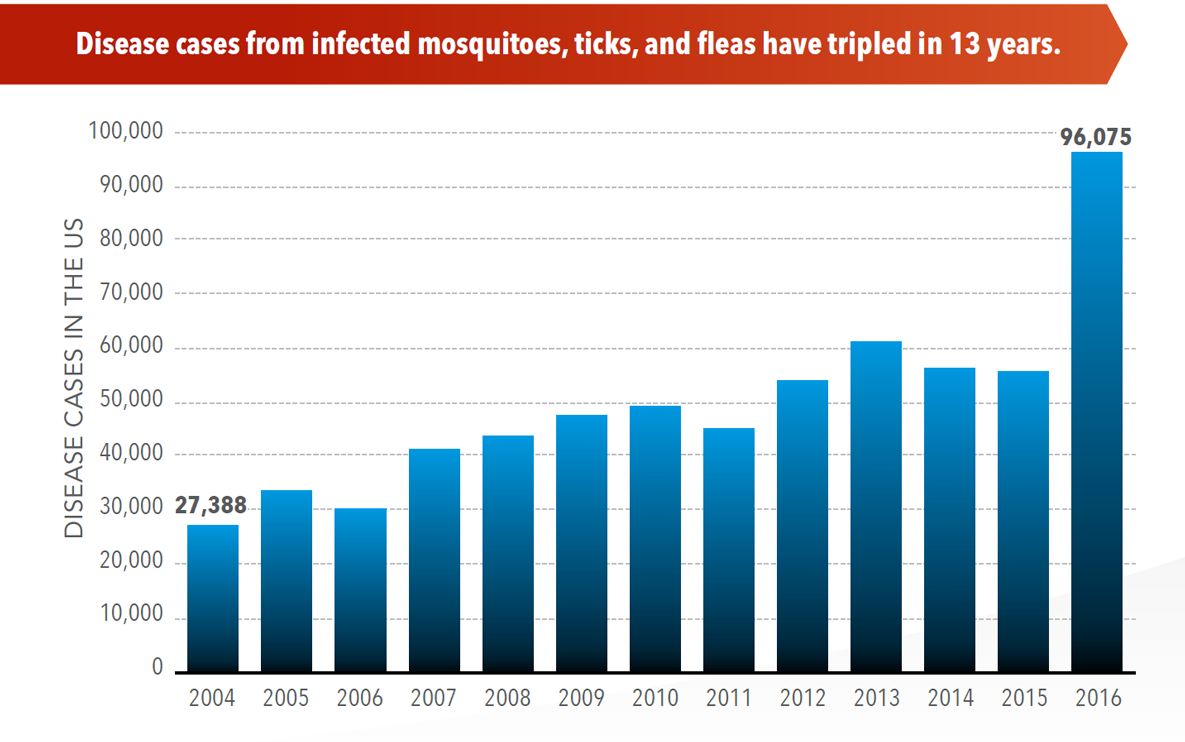
Disease cases from infected mosquitoes, ticks, and fleas have tripled in 13 years.
Disease cases in the US
The number of disease cases from infected mosquitoes, ticks, and fleas has increased from 27,388 in 2004 to 96,075 in 2016.
| Year | Total Vector-Borne Diseases |
| 2004 | 27,388 |
| 2005 | 33,882 |
| 2006 | 30,501 |
| 2007 | 41,408 |
| 2008 | 43,806 |
| 2009 | 47,663 |
| 2010 | 49,397 |
| 2011 | 45,178 |
| 2012 | 54,114 |
| 2013 | 61,146 |
| 2014 | 56,384 |
| 2015 | 55,660 |
| 2016 | 96,075 |
Source: CDC Vital Signs, May, 2018

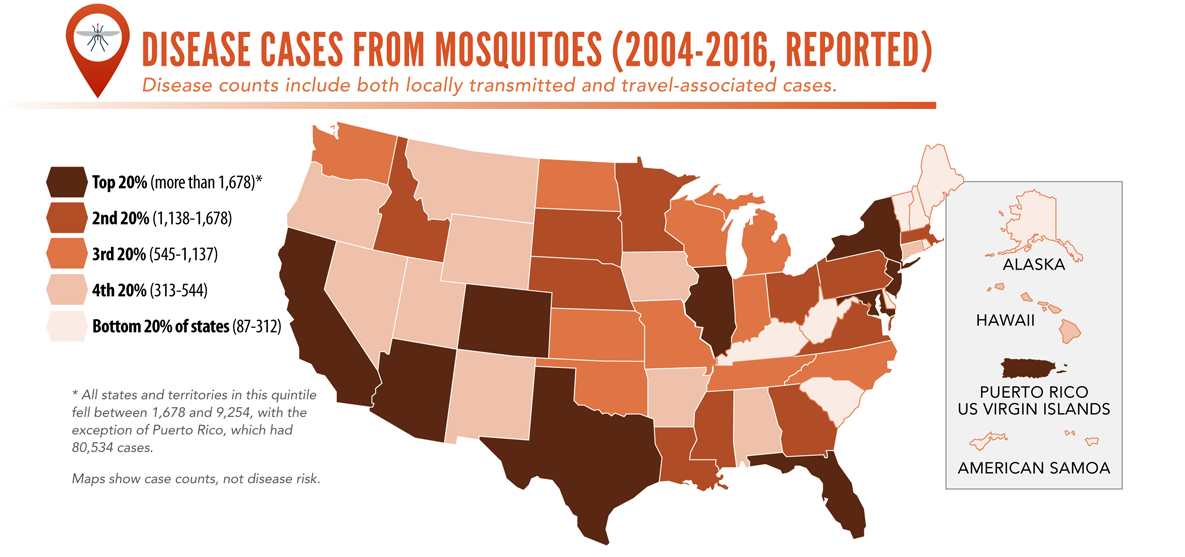
Disease cases from mosquitoes (2004-2016, reported)
Disease counts include both locally transmitted and travel-associated cases.
Top 20% (more than 1,678)*
2nd 20% (1,138-1,678)
3rd 20% (545-1,137)
4th 20% (313-544)
Bottom 20% of states (87-312)
*All states and territories in this quintile fell between 1,678 and 9,254, with the exception of Puerto Rico, which had 80,534 cases.
| Reporting Area | Mosquito-borne Disease Cases (No.) |
| Alabama | 408 |
| Alaska | 87 |
| Arizona | 2,186 |
| Arkansas | 364 |
| California | 9,254 |
| Colorado | 2,818 |
| Connecticut | 544 |
| Delaware | 124 |
| District of Columbia | 304 |
| Florida | 3,822 |
| Georgia | 1,420 |
| Hawaii | 414 |
| Idaho | 1,393 |
| Illinois | 2,582 |
| Indiana | 673 |
| Iowa | 531 |
| Kansas | 659 |
| Kentucky | 265 |
| Louisiana | 1,465 |
| Maine | 121 |
| Maryland | 1,925 |
| Massachusetts | 1,209 |
| Michigan | 1,059 |
| Minnesota | 1,458 |
| Mississippi | 1,137 |
| Missouri | 659 |
| Montana | 395 |
| Nebraska | 1,678 |
| Nevada | 442 |
| New Hampshire | 173 |
| New Jersey | 1,904 |
| New Mexico | 430 |
| New York | 7,167 |
| North Carolina | 968 |
| North Dakota | 1,057 |
| Ohio | 1,359 |
| Oklahoma | 853 |
| Oregon | 438 |
| Pennsylvania | 1,395 |
| Rhode Island | 294 |
| South Carolina | 312 |
| South Dakota | 1,337 |
| Tennessee | 699 |
| Texas | 6,648 |
| Utah | 498 |
| Vermont | 93 |
| Virginia | 1,319 |
| Washington | 781 |
| West Virginia | 238 |
| Wisconsin | 640 |
| Wyoming | 383 |
| American Samoa | 171 |
| Puerto Rico | 80,534 |
| U.S. Virgin Islands | 1,755 |
Maps show case counts, not disease risk

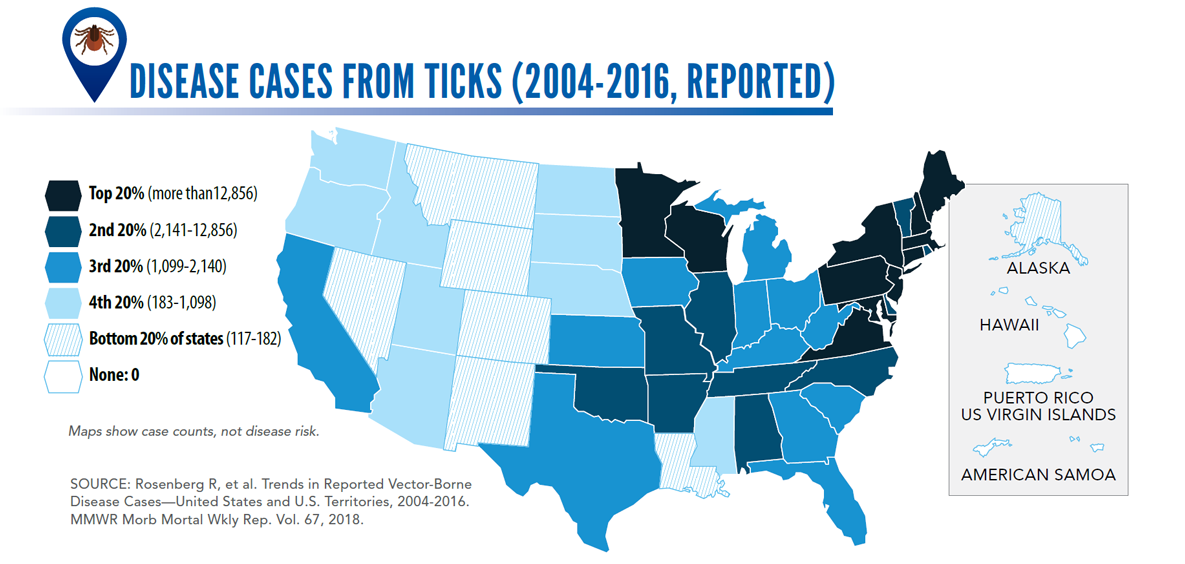
Disease cases from ticks (2004-2016, reported)
There were 5 categories for the results:
Top 20% (more than 12,856)
2nd 20% (2,141-12,856)
3rd 20% (1,099-2,140)
4th 20% (183-1,098)
Bottom 20% of states (117-182)
None: 0
| Reporting Area | Tickborne Disease Cases (No.) |
| Alabama | 2,451 |
| Alaska | 117 |
| Arizona | 546 |
| Arkansas | 7,094 |
| California | 1,408 |
| Colorado | 167 |
| Connecticut | 36,727 |
| Delaware | 8,486 |
| District of Columbia | 720 |
| Florida | 1,848 |
| Georgia | 1,427 |
| Hawaii | 0 |
| Idaho | 186 |
| Illinois | 3,685 |
| Indiana | 1,560 |
| Iowa | 2,046 |
| Kansas | 1,164 |
| Kentucky | 1,098 |
| Louisiana | 170 |
| Maine | 12,856 |
| Maryland | 22,166 |
| Massachusetts | 50,234 |
| Michigan | 1,493 |
| Minnesota | 26,886 |
| Mississippi | 539 |
| Missouri | 6,537 |
| Montana | 182 |
| Nebraska | 481 |
| Nevada | 131 |
| New Hampshire | 13,710 |
| New Jersey | 51,578 |
| New Mexico | 128 |
| New York | 69,313 |
| North Carolina | 9,075 |
| North Dakota | 319 |
| Ohio | 1,358 |
| Oklahoma | 4,670 |
| Oregon | 505 |
| Pennsylvania | 73,610 |
| Rhode Island | 7,095 |
| South Carolina | 1,143 |
| South Dakota | 200 |
| Tennessee | 5,950 |
| Texas | 2,140 |
| Utah | 198 |
| Vermont | 6,161 |
| Virginia | 16,454 |
| Washington | 300 |
| West Virginia | 1,964 |
| Wisconsin | 33,255 |
| Wyoming | 140 |
| American Samoa | 0 |
| Puerto Rico | 0 |
| U.S. Virgin Islands | 0 |
Maps show case counts, not disease risk.
SOURCE: Rosenberg R, et al. Trends in Reported Vector-Borne Disease Cases—United States and U.S. Territories, 2004-2016. MMWR Morb Mortal Wkly Rep. Vol. 67, 2018.
