Recommendations for Fully Vaccinated People
COVID-19 Homepage
Take Care
Interpretive Summary for February 18, 2022
Take Care
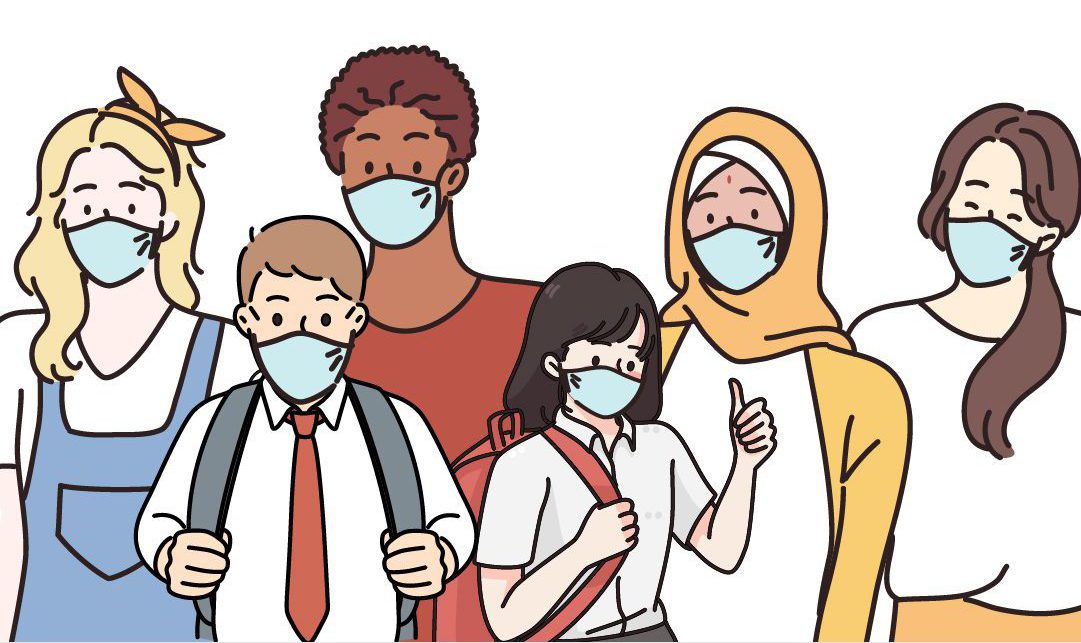
The past two years have been difficult for everyone, especially children. Beyond causing sickness, the pandemic has triggered uncertainty and loneliness, disrupted social and physical activities, and upended daily routines. Since the start of the pandemic, there have been more than 78 million COVID-19 cases, and more than 926,000 deaths reported in the United States. More than 140,000 children in the United States have lost parents and caregivers to COVID-19.
The findings of two new CDC studies suggest that the ongoing children’s mental health crisisExternal has gotten worse during the pandemic. Both studies examined pediatric emergency department (ED) visit data from 2019 through January 2022. One report indicates that, while pediatric ED visits decreased overall, the weekly number and proportion of ED visits increased for certain types of injuries, some chronic diseases, and behavioral health concerns. The other report shows that adolescent females may have experienced the largest overall increase in distress. During these years, the proportion of ED visits for eating disorders doubled and tic disorders more than tripled in this group. Adolescent females also visited the ED more often, for an increasingly wider variety of mental health conditions. Conditions such as these can be triggered by pandemic-related risk factors and made worse by pandemic-related reduced access to mental health care.
While prolonged time at home could increase familial support for some youth, it may have amplified challenges and stressors among other youth. These factors, as well as other pandemic-related stressors, could have created or added risk for mental health conditions and other behavioral health challenges. CDC supports efforts to promote the emotional well-being of children and adolescents by providing tools and resources to help increase access to children’s mental and behavioral health services, and aid families and communities in creating safe, stable, and nurturing environments that help children thrive.
CDC provides resources for adults, too—see Coping with Stress and Care for Yourself. Learning to cope with stress in a healthy way will help you, the people you care about, and those around you become more resilient.
- COVID Data Tracker’s Hospitalization by Vaccination Status – COVID-NET tab was updated to display monthly and weekly rates of COVID-19-associated hospitalization, comparing fully vaccinated people to people with an additional or booster dose for adults 18 years and older and adults 18-49 years.
- COVID Data Tracker’s Vaccination Demographics tab was updated to include data for people age 12 years and older and 65 years and older in the “Booster Eligible” chart.
- COVID Data Tracker’s COVID-19 during Pregnancy: Birth and Infant Outcomes tab was updated to include people who had COVID-19 during pregnancy in 2021.
- Effectiveness of Maternal Vaccination with mRNA COVID-19 Vaccine During Pregnancy Against COVID-19–Associated Hospitalization in Infants Aged <6 Months — 17 States, July 2021–January 2022
- Hospitalizations of Children and Adolescents with Laboratory-Confirmed COVID-19 — COVID-NET, 14 States, July 2021–January 2022
- Safety Monitoring of COVID-19 Vaccine Booster Doses Among Adults — United States, September 22, 2021–February 6, 2022
- Waning 2-Dose and 3-Dose Effectiveness of mRNA Vaccines Against COVID-19–Associated Emergency Department and Urgent Care Encounters and Hospitalizations Among Adults During Periods of Delta and Omicron Variant Predominance — VISION Network, 10 States, August 2021–January 2022
- Multistate Outbreak of SARS-CoV-2 B.1.1.529 (Omicron) Variant Infections Among Persons in a Social Network Attending a Convention — New York City, November 18–December 20, 2021
- Investigation of SARS-CoV-2 Transmission Associated With a Large Indoor Convention — New York City, November–December 2021
- Notes from the Field: Outbreak of COVID-19 Among a Highly Vaccinated Population Aboard a U.S. Navy Ship after a Port Visit — Reykjavik, Iceland, July 2021
- Pediatric Emergency Department Visits Before and During the COVID-19 Pandemic— United States, January 2019–January 2022
- Changes in Pediatric Emergency Department Visits Associated with Mental Health Conditions before and during the COVID-19 Pandemic — United States, January 2019–January 2022
Reported Cases
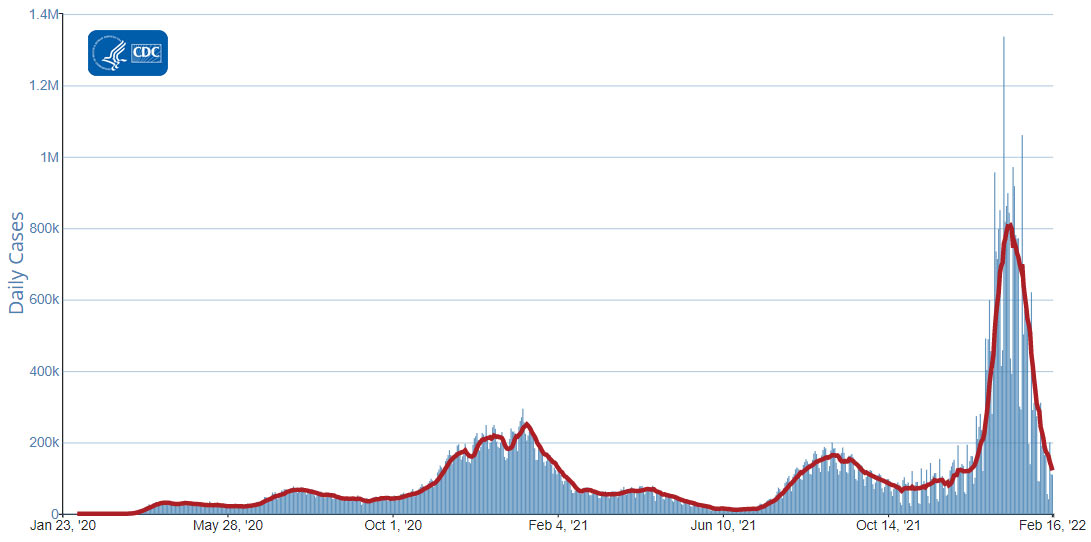
As of February 16, 2022, the current 7-day moving average of daily new cases (121,665) decreased 43.0% compared with the previous 7-day moving average (213,625). A total of 78,060,327 COVID-19 cases have been reported in the United States as of February 16, 2022.
Currently two variants, Omicron and Delta, are classified as Variants of Concern (VOC) in the United States. CDC Nowcast projections* for the week ending February 12, 2022, estimate the combined national proportion of lineages designated as Omicron to be 100%. There are five lineages designated as Omicron: B.1.1.529, BA.1, BA.1.1, BA.2, and BA.3. The COVID Data Tracker now shows the proportions of the B.1.1.529 lineage (includes BA.1 and BA.3), BA.1.1** lineage, and the BA.2 lineage. The predominant Omicron lineage in the United States is BA.1.1, which is descendent of the BA.1 lineage and is characterized by an additional substitution (R346K) in the spike protein. The national proportion of BA.1.1 is projected to be 73.2% (95% PI 69.0-77.1%). B.1.1.529 (BA.1 and BA.3) is projected to be 22.9% (95% PI 19.1-27.1%) and BA.2 is projected to be 3.9% (95% PI 2.8-5.3%). Delta is projected to continue to be 0.0% (95% PI 0.0-0.0%). Omicron is predicted to be 100% in all HHS regions.
78,060,327
Total Cases Reported
78,060,327
Total Cases Reported
121,665
Current 7-Day Average**
121,665
Current 7-Day Average**
213,625
Prior 7-Day Average
213,625
Prior 7-Day Average
-43.0%
Change in 7-Day Average since Prior Week
-43.0%
Change in 7-Day Average since Prior Week
*The median time from specimen collection to sequence data reporting is about 3 weeks. As a result, weighted estimates for the most recent few weeks may be unstable or unavailable. CDC’s Nowcast is a data projection tool that helps fill this gap by generating timely estimates of variant proportions for variants that are circulating in the United States. View Nowcast estimates on CDC’s COVID Data Tracker website on the Variant Proportions page.
**For national data, the proportion of BA.1.1 is shown separately. For regional data, the proportion of BA.1.1 is also aggregated with B.1.1.529.
***Historical cases are excluded from daily new cases and 7-day average calculations until they are incorporated into the dataset for the applicable date. Of 423,464 historical cases reported retroactively, 137 were reported in the current week and 24,081 were reported in the prior week.
Vaccinations
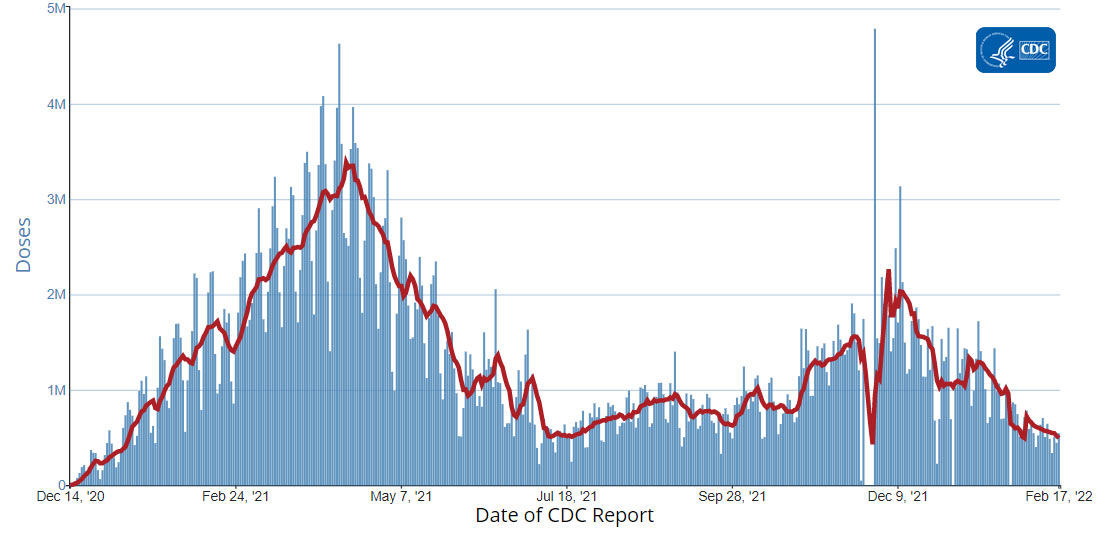
The U.S. COVID-19 Vaccination Program began December 14, 2020. As of February 16, 2022, 548.4 million vaccine doses have been administered in the United States. Overall, about 252.4 million people, or 76.0% of the total U.S. population, have received at least one dose of vaccine. About 214.2 million people, or 64.5% of the total U.S. population, have been fully vaccinated.* About 92.2 million additional or booster doses have been reported in people who have been fully vaccinated; however, 50.0% of the total booster-eligible population has not yet received a booster dose. As of February 16, 2022, the 7-day average number of administered vaccine doses reported (by date of CDC report) to CDC per day was 516,988, a 12.6% decrease from the previous week.
CDC’s COVID Data Tracker Vaccination Demographic Trends tab shows vaccination trends by age group and by race/ethnicity. As of February 16, 2022, 95.0% of people ages 65 years or older have received at least one dose of vaccine and 88.6% are fully vaccinated. For people ages 5 years or older, 80.8% have received at least one dose of vaccine and 68.6% are fully vaccinated.
As of February 16, 2022, of all race/ethnicity groups, the Asian Non-Hispanic population has the highest proportion that is fully vaccinated (59.6%) and the Black Non-Hispanic population has the lowest proportion that is fully vaccinated (40.3%). Of the fully vaccinated population, the Asian Non-Hispanic population has the highest proportion of additional/booster doses (64.5%) while the Hispanic/Latino population has the lowest proportion (37.6%).
548,391,614
Vaccine Doses Administered
548,391,614
Vaccine Doses Administered
252,400,057
People who received at least one dose
252,400,057
People who received at least one dose
214,218,580
People who are fully vaccinated*
214,218,580
People who are fully vaccinated*
76.0%
Percentage of the U.S. population that has received at least one dose
76.0%
Percentage of the U.S. population that has received at least one dose
64.5%
Percentage of the U.S. population that has been fully vaccinated*
64.5%
Percentage of the U.S. population that has been fully vaccinated*
+0.2
Percentage point increase from last week
+0.2
Percentage point increase from last week
+0.2
Percentage point increase from last week
+0.2
Percentage point increase from last week
*Represents the number of people who have received the second dose in a two-dose COVID-19 vaccine series (such as the Pfizer or Moderna vaccines) or one dose of the single-shot Johnson & Johnson’s Janssen vaccine.
Hospitalizations
New Hospital Admissions
The current 7-day daily average for February 9–February 15, 2022, was 8,642. This is a 28.8% decrease from the prior 7-day average (12,142) from February 2–February 8, 2022.
4,464,439
Total New Admissions
4,464,439
Total New Admissions
8,642
Current 7-Day Average
8,642
Current 7-Day Average
12,142
Prior 7-Day Average
12,142
Prior 7-Day Average
-28.8%
Change in 7-Day Average
-28.8%
Change in 7-Day Average
The start of consistent reporting of hospital admissions data was August 1, 2020.
Daily Trends in Number of New COVID-19 Hospital Admissions in the United States
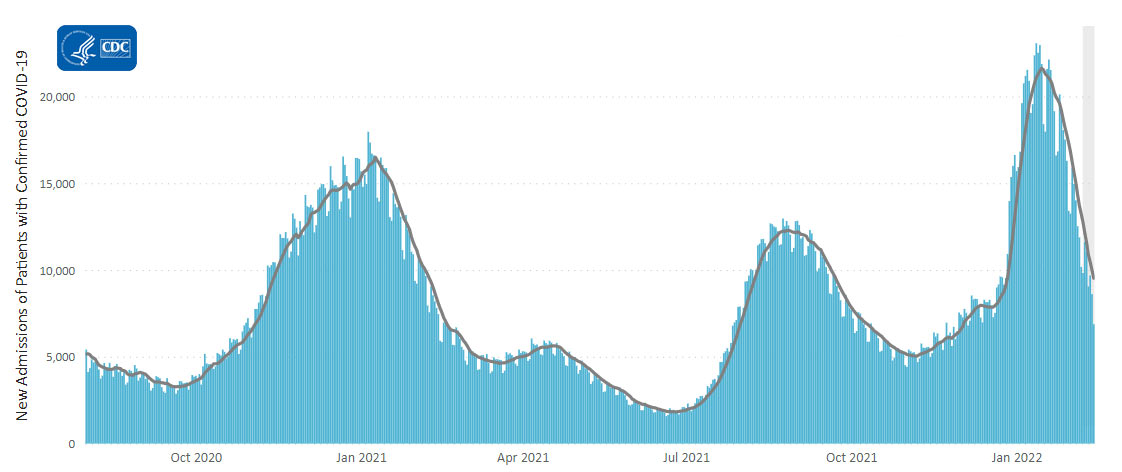
New admissions are pulled from a 10 am EST snapshot of the HHS Unified Hospital Timeseries Dataset. Due to potential reporting delays, data from the most recent 7 days, as noted in the figure above with the grey bar, should be interpreted with caution. Small shifts in historic data may also occur due to changes in the Centers for Medicare and Medicaid Services (CMS) Provider of Services file, which is used to identify the cohort of included hospitals.
COVID-NET: Trends in Hospitalization Rates among Children and Adolescents
CDC’s Coronavirus Disease 2019-Associated Hospitalization Surveillance Network (COVID-NET) shows that while the weekly rates of COVID-19-associated hospitalizations among children and adolescents are decreasing, they remain elevated. Weekly rates among children and adolescents ages 17 years and younger were 4.1 per 100,000 population for the week ending January 29, 2022. Rates of weekly COVID-19-associated hospitalizations among children and adolescents recently peaked at 6.9 per 100,000 population during the week ending January 8, 2022. This most recent peak was four times as high as the previous peak weekly rate of 1.8 per 100,000 observed for the week ending September 11, 2021. Among children and adolescents, rates are highest among children ages 4 years and younger who are not eligible for vaccination.
Additional information on COVID-19-associated hospitalizations among children and adolescents can be found in a new report using COVID-NET data here.
Trends in Hospitalization Rates among Children and Adolescents
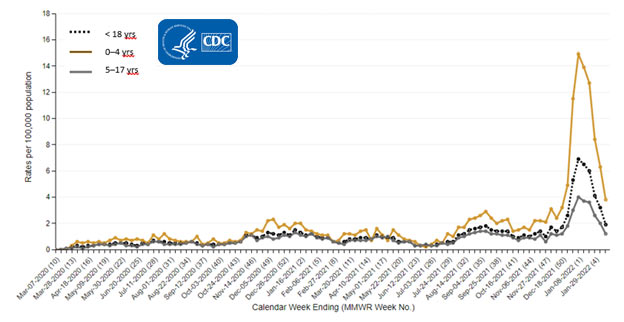
The Coronavirus Disease 2019 (COVID-19)-Associated Hospitalization Surveillance Network (COVID-NET) is an additional source for hospitalization data collected through a network of more than 250 acute-care hospitals in 14 states (representing ~10% of the U.S. population). Detailed data on patient demographics, including race/ethnicity, underlying medical conditions, medical interventions, and clinical outcomes, are collected with a standardized case reporting form.
Deaths
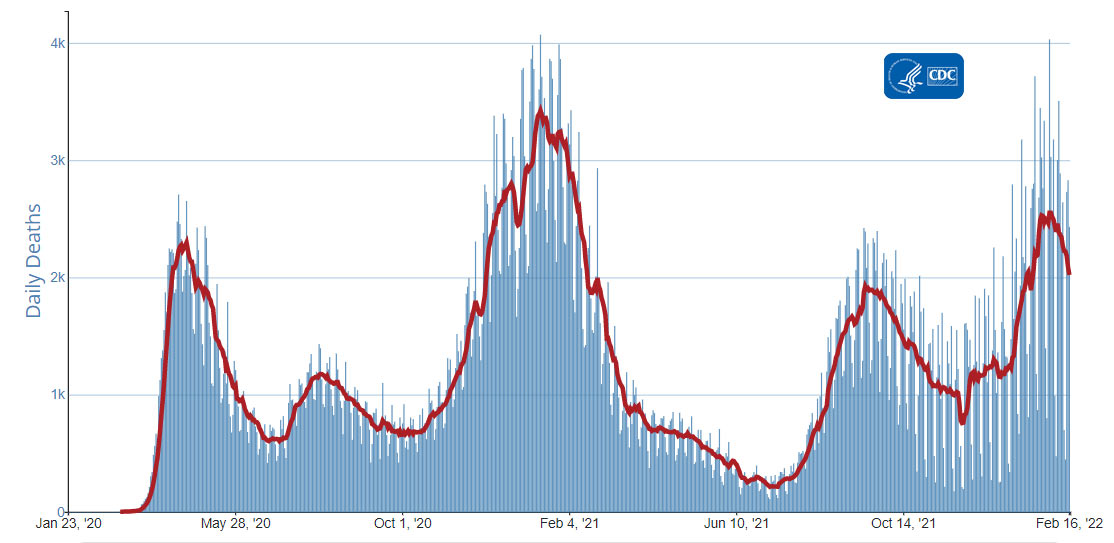
The current 7-day moving average of new deaths (2,021) has decreased 14.5% compared with the previous 7-day moving average (2,363). As of February 16, 2022, a total of 926,497 COVID-19 deaths have been reported in the United States.
926,497
Total Deaths Reported
926,497
Total Deaths Reported
2,021
Current 7-Day Average*
2,021
Current 7-Day Average*
2,363
Prior 7-Day Average
2,363
Prior 7-Day Average
-14.5%
Change in 7-Day Average Since Prior Week
-14.5%
Change in 7-Day Average Since Prior Week
*Historical deaths are excluded from the daily new deaths and 7-day average calculations until they are incorporated into the dataset by their applicable date. Of 20,882 historical deaths reported retroactively, 362 were reported in the current week; and none were reported in the prior week.
Daily Trends in Number of COVID-19 Deaths in the United States Reported to CDC

7-Day moving average
 More Death Data
Testing
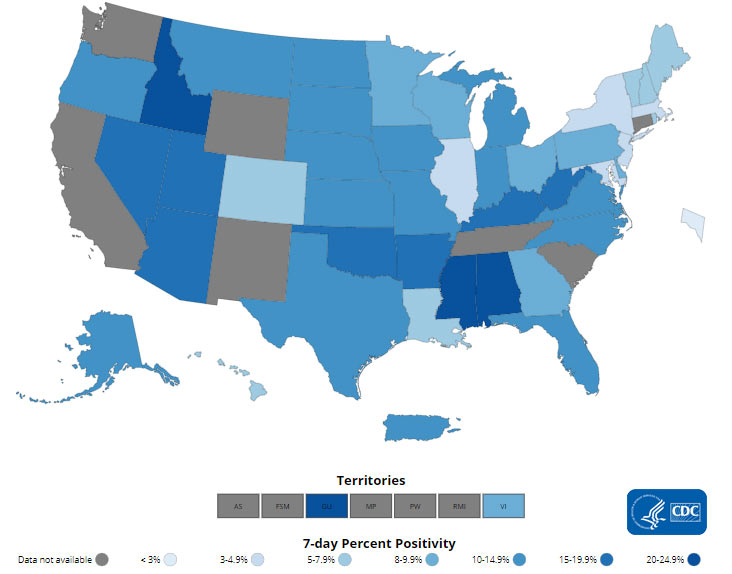
The percentage of COVID-19 NAATs (nucleic acid amplification tests)* that are positive (percent positivity) is decreasing in comparison to the previous week. The 7-day average of percent positivity from NAATs is now 8.4%. The 7-day average number of tests reported for February 4-10, 2022, was 1,234,960, down 14.8% from 1,449,539 for the prior 7 days.
804,440,450
Total Tests Reported
804,440,450
Total Tests Reported
1,234,960
7-Day Average Tests Reported
1,234,960
7-Day Average Tests Reported
8.4 %
7-Day Average % Positivity
8.4 %
7-Day Average % Positivity
12.9 %
Previous 7-Day Average % Positivity
12.9 %
Previous 7-Day Average % Positivity
-4.52
Percentage point change in 7-Day Average % Positivity since Prior Week
-4.52
Percentage point change in 7-Day Average % Positivity since Prior Week
*Test for SARS-CoV-2, the virus that causes COVID-19

