Recommendations for Fully Vaccinated People
COVID-19 Homepage

The Race to Vaccinate
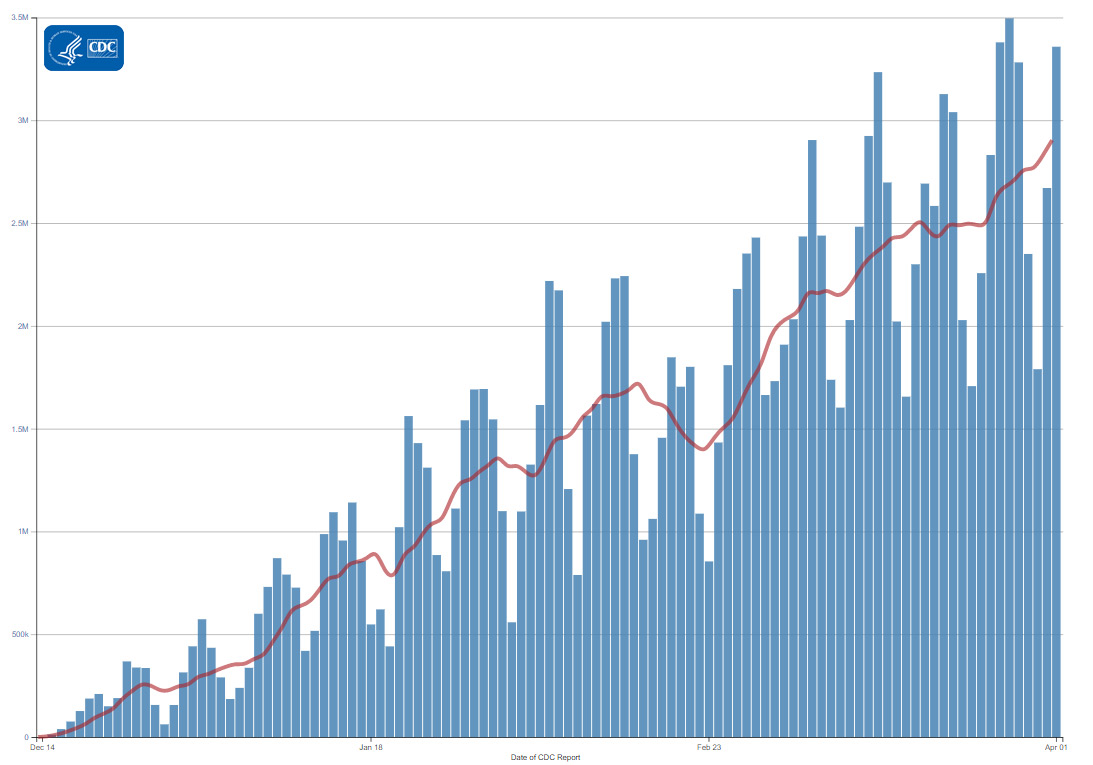
The United States recently administered a record 3.38 million doses of COVID-19 vaccine in a single day. As of April 1, 2021, nearly 154 million doses of COVID-19 vaccine have been administered in the United States, with over 56 million people having been fully vaccinated. We now have three historic, safe, and effective vaccines being administered across the country at a rapid pace, and more vaccines are in the works. A new CDC study shows that COVID-19 vaccines are effective at preventing COVID-19 infections and serious COVID-19 illness. Once fully vaccinated, a person’s risk of infection is reduced by up to 90%.
However, we are also seeing an increase in COVID-19 cases, including cases from new and emerging COVID-19 variants of concern. These variants of concern are mutated versions of the SARS-CoV-2 virus and have the potential to cause COVID-19 to be more severe, spread more easily between humans, require different treatments, or change the effectiveness of current vaccines.
Scientists continue to learn how the vaccines protect people from variants. Until most of the U.S. population is fully vaccinated, consistent use of public health prevention strategies, such as universal and correct use of masks, social distancing, hand washing, and vaccination, will help to limit the spread of SARS-CoV-2, the virus that causes COVID-19. Even if you have been fully vaccinated against COVID-19, you should keep taking these everyday precautions in public places.
The race to vaccinate people and contain the virus is underway. The actions we take today determine how long it will take to stop the virus and end the pandemic.
Reported Cases
COVID-19 cases were steadily decreasing for approximately 10 weeks; however, trends are changing, and cases have increased during the past 12 days. The current 7-day moving average of daily new cases (62,167) increased 8.4% compared with the previous 7 days. Compared with previous peaks, however, the 7-day average decreased 75.2% compared with the highest peak on January 11, 2021 (250,446), and 7.7% compared with the second highest peak on July 23, 2020 (67,337).
64,149
New Cases Reported*
64,149
New Cases Reported*
62,167
Current 7-Day Average**
62,167
Current 7-Day Average**
30,277,908
Total Cases Reported
30,277,908
Total Cases Reported
57,343
Prior 7-Day Average
57,343
Prior 7-Day Average
250,446
Peak of 7-Day Average***
250,446
Peak of 7-Day Average***
+8.4%
Change in 7-Day Average since Prior Week
+8.4%
Change in 7-Day Average since Prior Week
*New cases and 7-day averages reported here may differ slightly from those on the COVID Data Tracker as we continue to incorporate jurisdictions’ updates to their historical data.
**Historical cases are excluded from 7-day average calculations. Of 22,178 historical cases reported retroactively, 4,451 were reported in the current week, and 1,775 in the prior week.
***Highest peak for 7-day average (January 11, 2021).
Note: The table above excludes historical data from the new cases, the current and previous 7-day averages, and the percent change in the 7-day average.
Daily Trends in COVID-19 Cases in the United States Reported to CDC

7-Day moving average
SARS-CoV-2 Variants
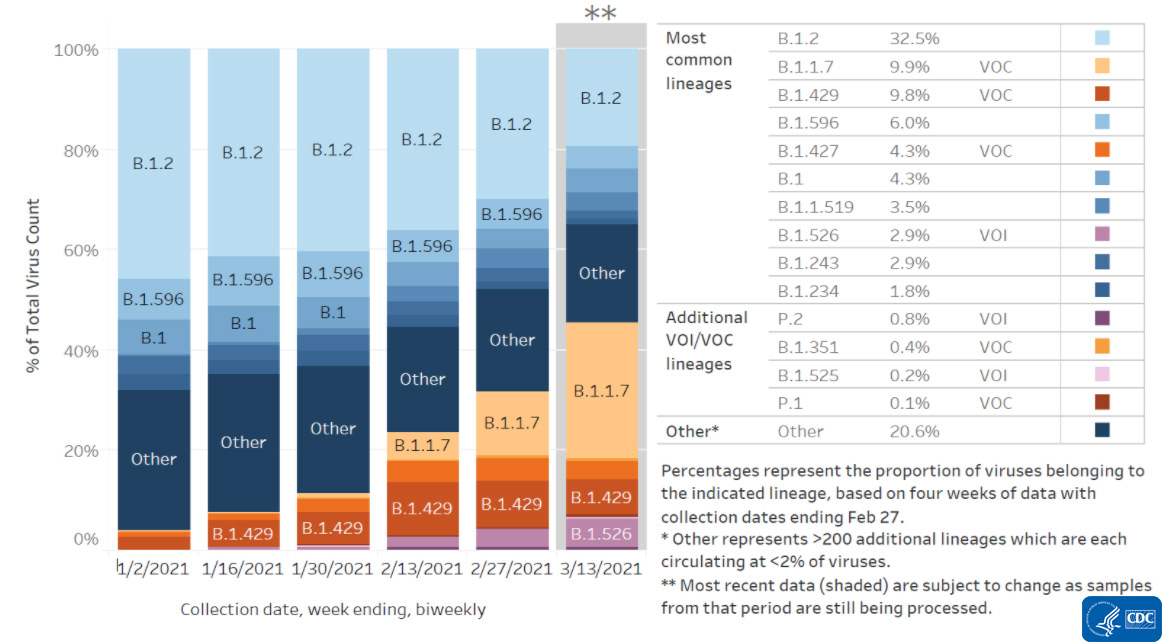
CDC recently updated the Variant Proportions in the U.S. web page to include the most recent proportions of SARS-CoV-2 variants nationally and in states where there is enough data for CDC to monitor variants. Also, a new Variant Surveillance Section of the COVID Data Tracker was recently published with sequencing data and the global variant report map by country.
As of April 1, 2021, 12,505 B.1.1.7 variant cases have been reported in 51 jurisdictions. The United States has detected a total of 323 cases attributed to B.1.351 in 31 jurisdictions and 224 cases attributed to P.1 in 22 jurisdictions. In addition, we are closely monitoring the B.1.427 and B.1.429 variants that were first identified in the United States in January 2021. CDC and partners are increasing the numbers of specimens sequenced in laboratories around the country. Studies are underway to determine whether variants are more transmissible, cause more severe illness, or are likely to evade immunity brought on by prior illness or vaccination.
Variant
Variant
Variant
Reported Cases in US
Reported Cases in US
Reported Cases in US
Number of Jurisdictions with ≥1 Case Reported
Number of Jurisdictions with ≥1 Case Reported
Number of Jurisdictions with ≥1 Case Reported
B.1.1.7
Variant
B.1.1.7
12,505
Reported Cases in US
12,505
51
Number of Jurisdictions with ≥1 Case Reported
51
B.1.351
Variant
B.1.351
323
Reported Cases in US
323
31
Number of Jurisdictions with ≥1 Case Reported
31
P.1
Variant
P.1
224
Reported Cases in US
224
22
Number of Jurisdictions with ≥1 Case Reported
22
Testing
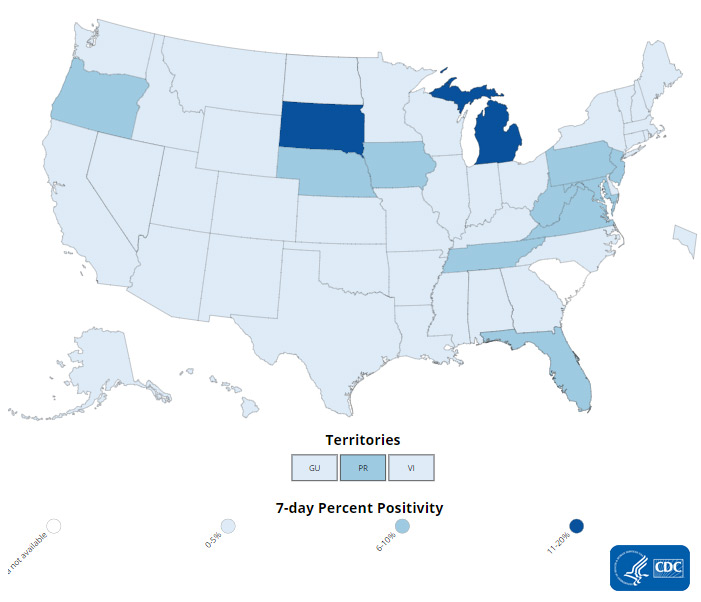
The percentage of COVID-19 RT-PCR tests that are positive (percent positivity) has increased slightly from the previous week. The 7-day average of percent positivity from tests is now 5.1%. The 7-day average test volume for March 19-March 25, 2021, was 1,162,774, down 1.5% from 1,180,332 for the prior 7 days.
375,521,522
Total Tests Reported
375,521,522
Total Tests Reported
1,162,774
7-Day Average Test Volume
1,162,774
7-Day Average Test Volume
5.1%
7-Day Average
% Positivity
5.1%
7-Day Average
% Positivity
+13.0%
Change in 7-Day
% Positivity
+13.0%
Change in 7-Day
% Positivity
COVID-19 Viral (RT-PCR) Laboratory Test 7-day Percent Positivity by State/Territory
Vaccinations
The U.S. COVID-19 Vaccination Program began December 14. As of April 1, 2021, 153.6 million vaccine doses have been administered. Overall, about 99.6 million people, or 30% of the U.S. population, have received at least one dose of vaccine. About 56.1 million people, or 16.9% of the U.S. population have been fully vaccinated.* As of April 1, the 7-day average number of administered vaccine doses reported to CDC per day was 2.9 million, a 15.7% increase from the previous week.
The new COVID Data Tracker Vaccination Demographic Trends tab shows vaccination trends by age group. As of April 1, 73.7% of people 65 or older have received at least one dose of vaccine; 52% are fully vaccinated. More than one-third (38.4%) of people 18 or older have received at least one dose of vaccine; 21.7% are fully vaccinated.
153,631,404
Vaccines Administered
153,631,404
Vaccines Administered
99,565,311
People who received at least one dose
99,565,311
People who received at least one dose
56,089,614
People who are fully vaccinated*
56,089,614
People who are fully vaccinated*
30%
Percentage of the U.S. population that has received at least 1 dose
30%
Percentage of the U.S. population that has received at least 1 dose
16.9%
Percentage of the U.S. population that has been fully vaccinated*
16.9%
Percentage of the U.S. population that has been fully vaccinated*
*People who are fully vaccinated (formerly “receiving 2 doses”) represents the number of people who have received the second dose in a two-dose COVID-19 vaccine series or one dose of the single-shot J&J/Janssen COVID-19 vaccine.
Daily Change in Number of COVID-19 Vaccinations in the United States Reported to CDC

7-Day moving average
New Hospital Admissions
Hospital admissions of patients with confirmed COVID-19 decreased by 70.1% from the national 7-day average peak of 16,522 admissions on January 9, 2021, to an average of 4,948 admissions over the 7-day period ending March 30, 2021. This, however, is a 4.8% increase from the previous 7-day period.
5,261
New Admissions
5,261
New Admissions
4,948
Current 7-Day Average
4,948
Current 7-Day Average
1,947,825
Total New Admissions
1,947,825
Total New Admissions
4,722
Prior 7-Day Average
4,722
Prior 7-Day Average
16,522
Peak 7-Day Average
16,522
Peak 7-Day Average
+4.8%
Change in 7-Day Average
+4.8%
Change in 7-Day Average
Daily Trends in Number of New COVID-19 Hospital Admissions in the United States
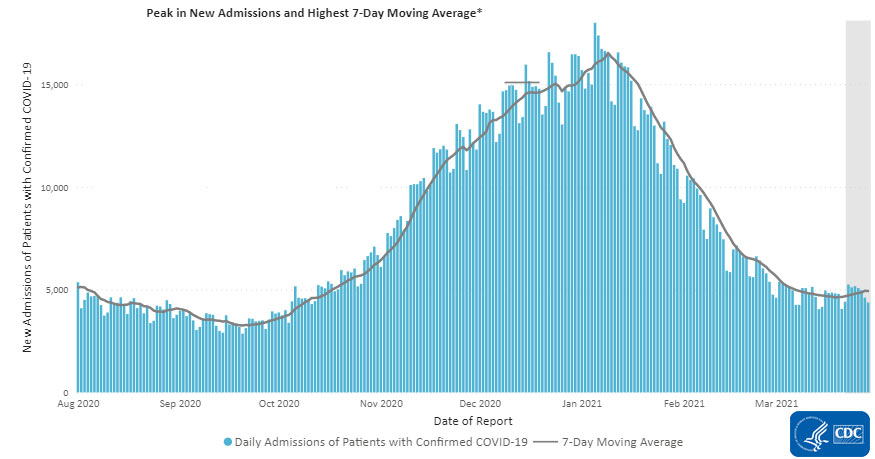
The most recent data in the vertical gray bar are provisional and should be interpreted with caution.
Trends in Hospitalizations among Racial and Ethnic Minority Groups
Long-standing systemic health and social inequities have increased the risk for severe COVID-19 illnesses and death for many people in racial and ethnic minority groups. By improving race and ethnicity data collection and reporting, we continue to increase our understanding of health disparities related to COVID-19. This knowledge helps us create more equitable public health policies and prevention strategies.
COVID-19-associated hospitalization rates have decreased in all races and ethnicities after peaking in early January. Rates for American Indian and Alaska Native persons have dropped from a peak of 47.4 per 100,000 in November to less than 10 per 100,000 in recent weeks. Declines of more than 50% have been seen for other race and ethnicity groups. In addition, hospitalizations have decreased from their highest point in early January 2021.
Rates of COVID-19-Associated Hospitalization
The Coronavirus Disease 2019 (COVID-19)-Associated Hospitalization Surveillance Network (COVID-NET) is an additional source for hospitalization data collected through a network of more than 250 acute-care hospitals in 14 states (representing ~10% of the U.S. population). Detailed data on patient demographics, including race/ethnicity, underlying medical conditions, medical interventions, and clinical outcomes, are collected using a standardized case reporting form.
Deaths
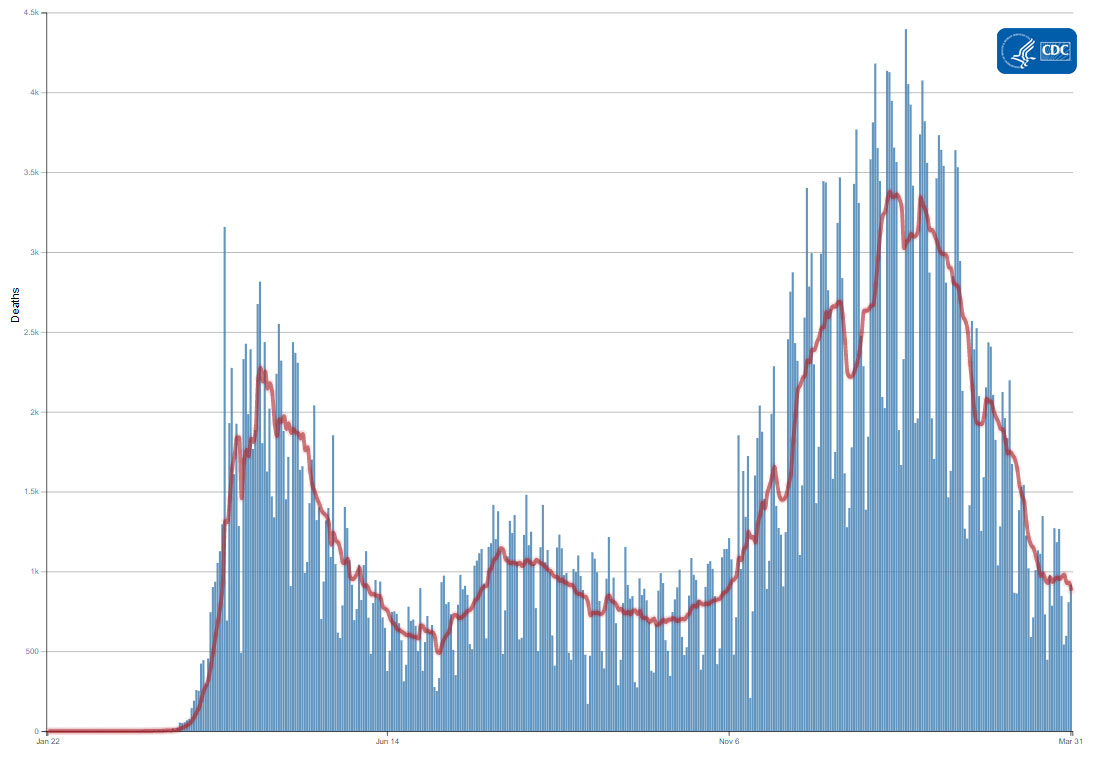
Except for an increase during March 27-28, 2021, overall, deaths have decreased for the past 11 weeks. On March 31, the 7-day average of daily new deaths decreased 7.7% compared with the prior 7 days (although the absolute number of deaths increased compared to the previous day). Compared with prior peaks, the current 7-day moving average of 880 daily new deaths decreased 74.0% compared with the highest peak on January 13, 2021 (3,379 deaths), and 23.3% compared with the peak on August 1, 2020 (1,148 deaths). As of March 31, 2021, a total of 549,098 COVID-19 deaths have been reported.
917
New Deaths Reported*
917
New Deaths Reported*
880
Current 7-Day Average**
880
Current 7-Day Average**
549,098
Total Deaths Reported
549,098
Total Deaths Reported
953
Prior 7-Day Average
953
Prior 7-Day Average
3,379
Peak of 7-day Average***
3,379
Peak of 7-day Average***
-7.7%
Change in the 7-Day Average Since the Prior Week
-7.7%
Change in the 7-Day Average Since the Prior Week
*New cases and 7-day averages reported here may differ slightly from those on the COVID Data Tracker as we continue to incorporate jurisdictions’ updates to their historical data.
** Of 13,233 historical deaths reported retroactively, 19 were reported on March 31, 2021; 286 were reported in the current week; and 655 in the prior week.
*** The highest peak in the 7-day average of new deaths (Jan 13, 2021).
Note: The table above excludes historical data from the new deaths, the current and previous 7-day averages, and the percent change in the 7-day average.
Daily Trends in Number of COVID-19 Deaths in the United States Reported to CDC

7-Day moving average
- Death Certificate–Based ICD-10 Diagnosis Codes for COVID-19 Mortality Surveillance — United States, January–December 2020
- Interim Estimates of Vaccine Effectiveness of BNT162b2 and mRNA-1273 COVID-19 Vaccines in Preventing SARS-CoV-2 Infection Among Health Care Personnel, First Responders, and Other Essential and Frontline Workers — Eight U.S. Locations, December 2020–March 2021
- Provisional Mortality Data — United States, 2020
Recent COVID Data Tracker Updates
- New county-level vaccination data on the County View tab allow users to view and download data at the county level, including percent of total population fully vaccinated, percent of the population ≥18 years of age fully vaccinated, and percent of the population ≥65 years of age fully vaccinated.
- New Vaccination Demographic Trends tab shows vaccination trends by age group.
- New Genomic Surveillance section of COVID Data Tracker tracks published COVID-19 genomic sequences and the global variant report map by country.
- New COVID-NET Hospitalization Surveillance Network tab in the Health Care Settings Data section allows users to view COVID-19-associated hospitalizations by age, sex, race/ethnicity, underlying medical conditions, and more, over time.

