Recommendations for Fully Vaccinated People
COVID-19 Homepage

Vigilance Matters When Viruses Vary
The United States is in the fourth week of an upward trend in COVID-19 cases. The lifting of social distancing and mask mandates in some areas could be contributing to this increase. This increase could also be due to the presence of more contagious variants of SARS-CoV-2, the virus that causes COVID-19, which is why it is important to remain vigilant.
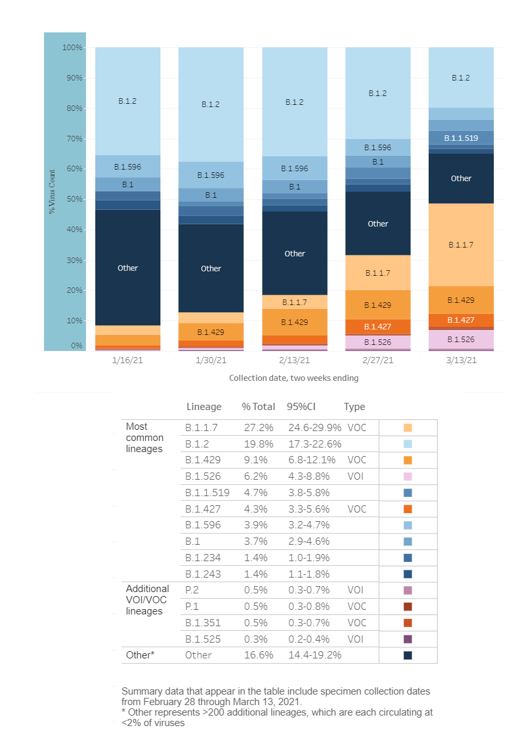
Viruses change constantly through mutation, so new variants are expected to occur as the virus spreads. Some variants pose a bigger threat than others. B.1.1.7 is the most common variant circulating in the United States and has been reported in all 50 states, the District of Columbia, and Puerto Rico. Understanding variants and their spread will help us contain the virus.
CDC recently introduced a classification system to rank the risk of the variants that we are monitoring, similar to the way the weather service ranks hurricanes. The classification system characterizes emerging variants based on their characteristics and the resulting actions and consequences for public health. CDC’s three classification categories include Variants of Interest (VOI), Variants of Concern (VOC) and Variants of High Consequence (VOHC). CDC is currently monitoring five variants of concern in the United States; none of the variants circulating in the United States are classified as variants of high consequence. Many of the variants circulating in the United States do not fall into one of these categories, but CDC continues to monitor them.
| Variant of Interest | Variant of Concern | Variant of High Consequence* | |
|---|---|---|---|
| Predicted to be more contagious | Yes | Yes | Yes |
| Predicted to be more difficult to detect | Yes | Yes | Yes |
| Evidence of more cases or unique clusters of outbreaks | Yes | Yes | Yes |
| Evidence shows this variant might require alternative treatments and vaccines might be less effective | No | Yes | Yes |
| Evidence shows this variant spreads more easily from person to person | No | Yes | Yes |
| Evidence shows this variant causes more severe disease | No | Yes | Yes |
| Requires notification to the World Health Organization and CDC | No | Yes | Yes |
| Evidence shows significant diagnostic testing failures | No | No | Yes |
| Evidence shows that vaccines are significantly less effective at preventing severe illness | No | No | Yes |
| Treatment is significantly less effective | No | No | Yes |
Variants may have one or more of the listed attributes
*none at this time
The best way to slow the emergence of new variants is to slow the spread of COVID-19 by wearing a mask that covers your nose and mouth, staying 6 feet away from people who don’t live with you, avoiding crowds and poorly ventilated indoor spaces, and getting a COVID-19 vaccine as soon as it is available to you.
Reported Cases
Since March 20, 2021, the 7-day moving average of new cases has consistently remained higher compared with the previous 7-day moving average. The current 7-day moving average of daily new cases (64,152) increased 2.0% compared with the previous 7-day moving average. However, the 7-day average decreased 74.3% compared with the highest peak on January 8, 2021 (249,697), and 4.7% compared with the second highest peak on July 23, 2020 (67,348). A total of 30,737,477 COVID-19 cases were reported as of April 7, 2021, including 74,860 new cases.
74,860
New Cases Reported
74,860
New Cases Reported
64,152
Current 7-Day Average*
64,152
Current 7-Day Average*
30,737,477
Total Cases Reported
30,737,477
Total Cases Reported
62,869
Prior 7-Day Average
62,869
Prior 7-Day Average
249,697
Peak of 7-Day Average**
249,697
Peak of 7-Day Average**
+2.0%
Change in 7-Day Average since Prior Week
+2.0%
Change in 7-Day Average since Prior Week
*Historical cases are excluded from 7-day average calculations. Of 24,809 historical cases reported retroactively, 2,631 were reported in the current week, and 4,451 were reported in the prior week.
**Highest peak for 7-day average (January 8, 2021).
Note: The table above excludes historical data from the new cases, the current and previous 7-day averages, and the percent change in the 7-day average.
Daily Trends in COVID-19 Cases in the United States Reported to CDC

7-Day moving average
SARS-CoV-2 Variants
CDC recently updated the COVID Data Tracker to include the most recent proportions of SARS-CoV-2 variants nationally and in states where there is enough data for CDC to monitor variants. The Variant Surveillance section of the COVID Data Tracker provides an overview of published sequencing data and a global variant report map by country.
To provide a better picture of how widespread specific variants are in the US, CDC analyzes available genomic sequence data from specimens of SARS-CoV-2 collected from patients. This data is weighted to account for known differences in diagnostic testing and sequencing across time and geography. Based on the currently available data from early March, an estimated 27.2% of COVID-19 cases in the United States are caused by the SARS-CoV-2 variant B.1.1.7. The proportion of cases caused by B.1.429 is estimated at 9.1% and the proportion of cases caused by B.1.427 is estimated at 4.3%. Variants P.1 and B.1.351 are both estimated to be 0.5% of the current COVID-19 cases.
CDC and partners are increasing the numbers of specimens sequenced in laboratories around the country. Studies are underway to determine whether variants are more transmissible, cause more severe illness, or are likely to evade immunity brought on by prior illness or vaccination.
Variant
Variant
Variant
Reported Cases in US
Reported Cases in US
Reported Cases in US
Number of Jurisdictions with ≥1 Case Reported
Number of Jurisdictions with ≥1 Case Reported
Number of Jurisdictions with ≥1 Case Reported
B.1.1.7
Variant
B.1.1.7
19,554
Reported Cases in US
19,554
52
Number of Jurisdictions with ≥1 Case Reported
52
B.1.351
Variant
B.1.351
424
Reported Cases in US
424
36
Number of Jurisdictions with ≥1 Case Reported
36
P.1
Variant
P.1
434
Reported Cases in US
434
28
Number of Jurisdictions with ≥1 Case Reported
28
Testing
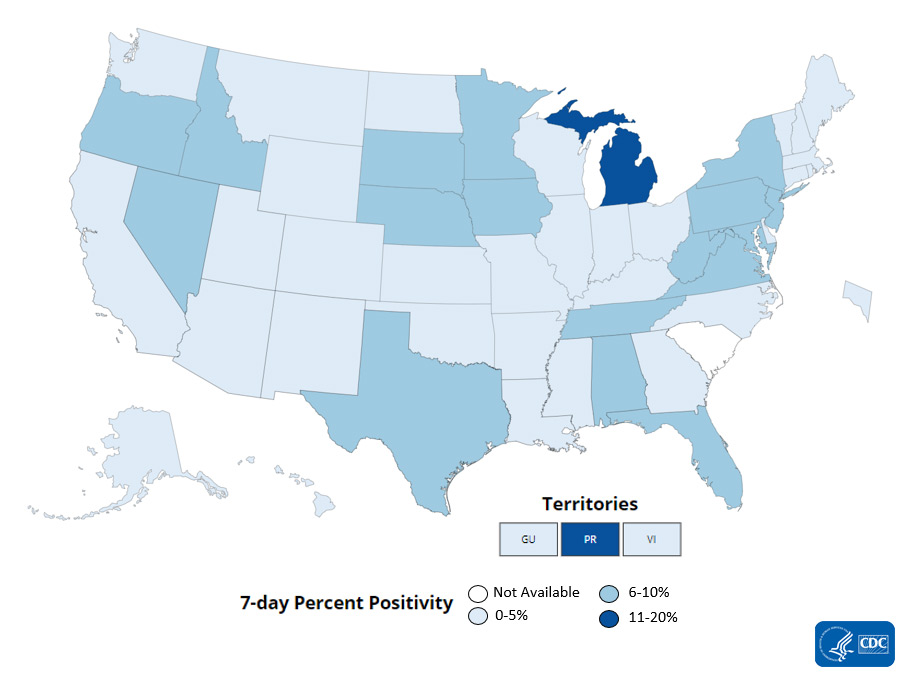
The percentage of COVID-19 RT-PCR tests that are positive (percent positivity) has increased from the previous week. The 7-day average of percent positivity from tests is now 5.5%. The 7-day average test volume for March 26–April 1, 2021, was 1,172,235, down 2.2% from 1,198,428 for the prior 7 days.
384,580,206
Total Tests Reported
384,580,206
Total Tests Reported
1,172,235
7-Day Average Test Volume
1,172,235
7-Day Average Test Volume
5.5%
7-Day Average
% Positivity
5.5%
7-Day Average
% Positivity
+8.7%
Change in 7-Day
% Positivity
+8.7%
Change in 7-Day
% Positivity
COVID-19 Viral (RT-PCR) Laboratory Test 7-day Percent Positivity by State/Territory
Vaccinations
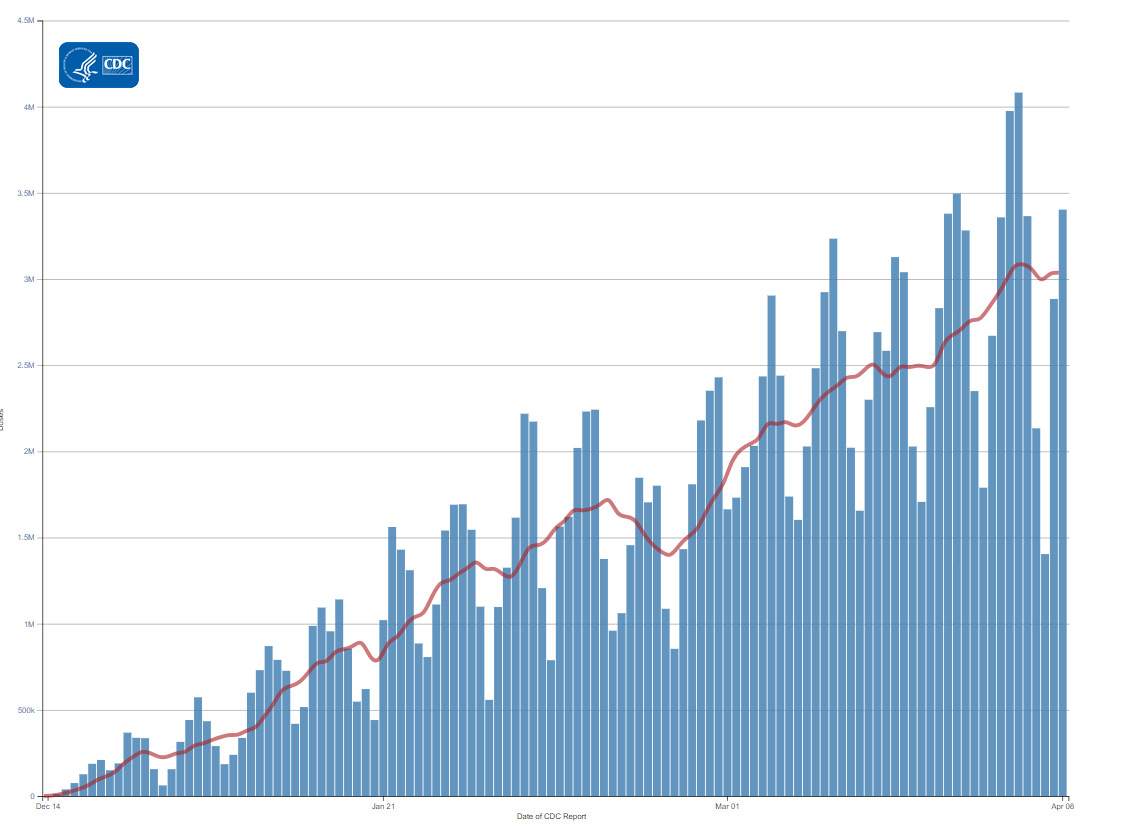
The US COVID-19 Vaccination Program began December 14. As of April 8, 2021, 174.9 million vaccine doses have been administered. Overall, about 112.0 million people, or 33.7% of the US population, have received at least one dose of vaccine. About 66.2 million people, or 19.9% of the US population, have been fully vaccinated.* As of April 8, the 7-day average number of administered vaccine doses reported to CDC per day was 3.0 million, a 4.5% increase from the previous week.
The COVID Data Tracker Vaccination Demographic Trends tab shows vaccination trends by age group. As of April 8, 76.9% of people 65 or older have received at least one dose of vaccine; 58.4% are fully vaccinated. More than one-third (43.2%) of people 18 or older have received at least one dose of vaccine; 25.6% are fully vaccinated.
174,879,716
Vaccines Administered
174,879,716
Vaccines Administered
112,046,611
People who received at least one dose
112,046,611
People who received at least one dose
66,203,123
People who are fully vaccinated*
66,203,123
People who are fully vaccinated*
33.7%
Percentage of the US population that has received at least one dose
33.7%
Percentage of the US population that has received at least one dose
19.9%
Percentage of the US population that has been fully vaccinated*
19.9%
Percentage of the US population that has been fully vaccinated*
+3.7
percentage point increase from last week
+3.7
percentage point increase from last week
+3.0
percentage point increase from last week
+3.0
percentage point increase from last week
*People who are fully vaccinated (formerly “receiving 2 doses”) represents the number of people who have received the second dose in a two-dose COVID-19 vaccine series or one dose of the single-shot J&J/Janssen COVID-19 vaccine.
Daily Change in Number of COVID-19 Vaccinations in the United States Reported to CDC

7-Day moving average
New Hospital Admissions
Hospital admissions of patients with confirmed COVID-19 decreased by 67.7% from the national 7-day average peak of 16,521 admissions on January 9, 2021, to an average of 5,336 admissions over the 7-day period ending April 06, 2021. This however is a 7.3% increase from the previous 7-day period (March 24–30, 2021).
6,583
New Admissions
6,583
New Admissions
5,336
Current 7-Day Average
5,336
Current 7-Day Average
1,985,128
Total New Admissions
1,985,128
Total New Admissions
4,974
Prior 7-Day Average
4,974
Prior 7-Day Average
16,521
Peak 7-Day Average*
16,521
Peak 7-Day Average*
+7.3%
Change in 7-Day Average
+7.3%
Change in 7-Day Average
*Highest peak for 7-day average (January 9, 2021).
Daily Trends in Number of New COVID-19 Hospital Admissions in the United States

The most recent data in the vertical gray bar are provisional and should be interpreted with caution.
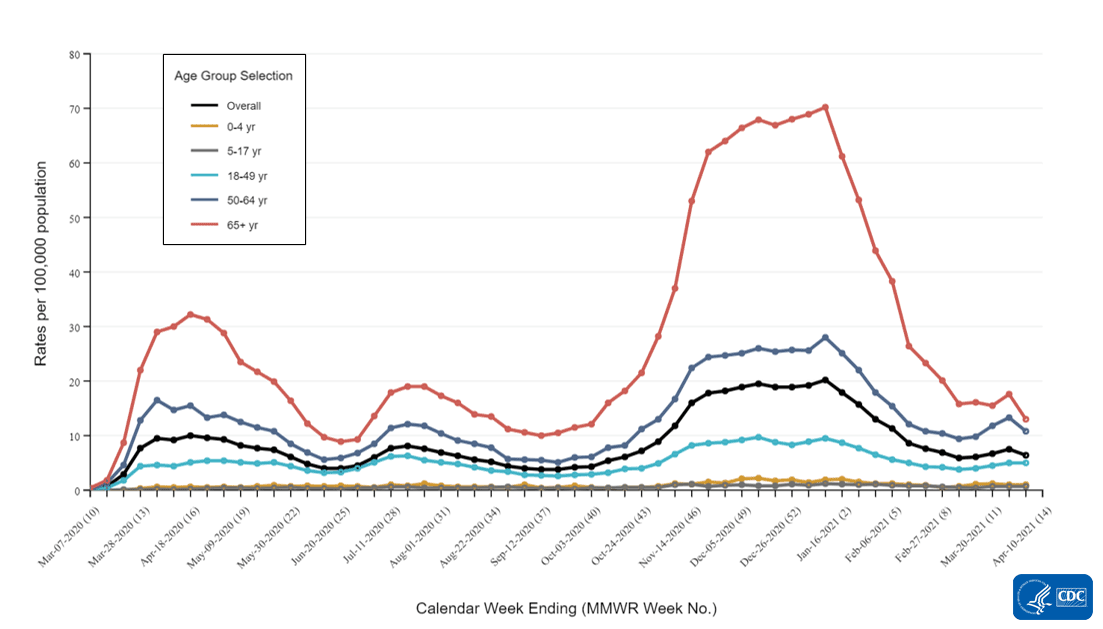
Trends in Hospitalizations by Age Group
Older adults are at increased risk for severe COVID-19 illness, including an increased risk for hospitalization. Since the start of the pandemic, adults aged 65 years and older were the age group with the highest rates of COVID-19-associated hospitalization. While rates of hospitalization have fallen for all age groups since the peak in early January 2021, the rates for these older adults have fallen the most. Rates of hospitalization in adults aged 65 years and older have decreased by more than 70% in the past two months, from 70.2 per 100,000 in early January to less than 20 per 100,000 in recent weeks. However, rates have plateaued or risen in recent weeks in all age groups.
Rates of COVID-19-Associated Hospitalizations
The Coronavirus Disease 2019 (COVID-19)-Associated Hospitalization Surveillance Network (COVID-NET) is an additional source for hospitalization data collected through a network of more than 250 acute-care hospitals in 14 states (representing ~10% of the U.S. population). Detailed data on patient demographics, including race/ethnicity, underlying medical conditions, medical interventions, and clinical outcomes, are collected using a standardized case reporting form.
Deaths
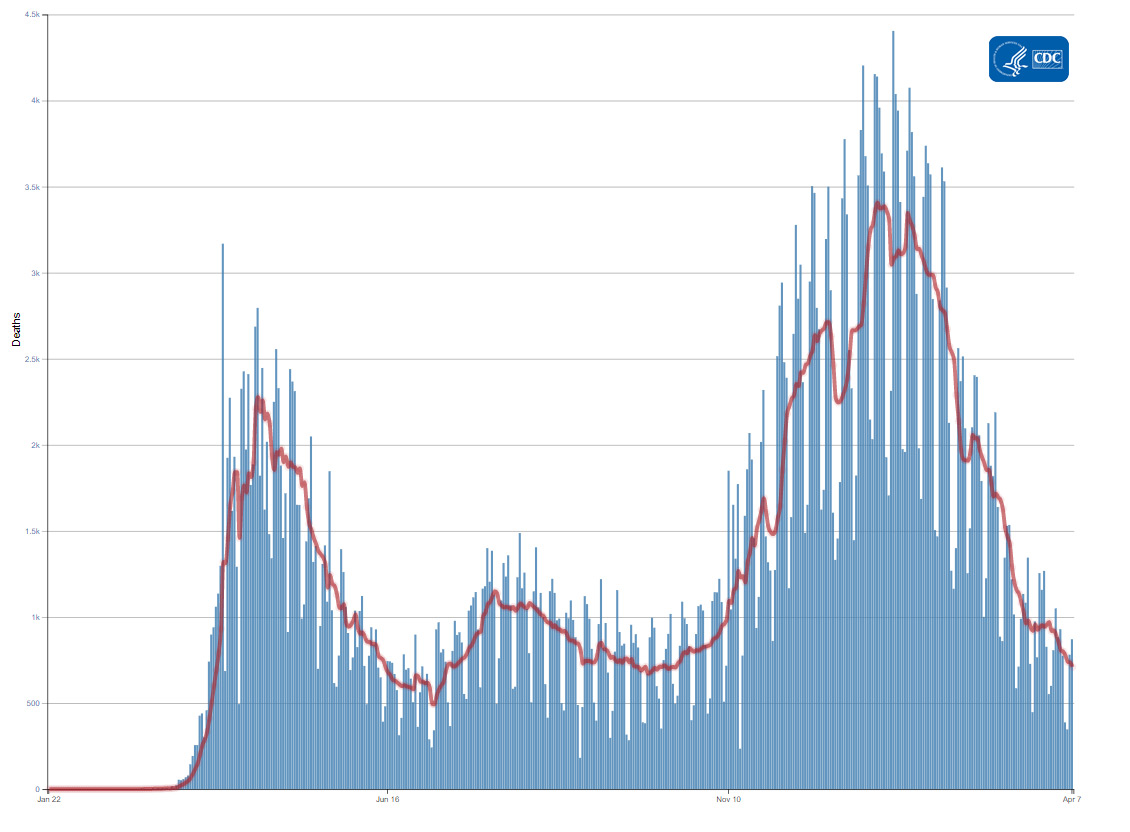
Overall, the 7-day moving average of daily new deaths has generally decreased for the past 12 weeks. On April 7, the 7-day average of daily new deaths (711) decreased 20.6% compared with the prior 7-day average; decreased 79.2% compared with the highest peak on January 13, 2021 (3,409); and decreased 38.2% compared with the peak on August 1, 2020 (1,151). As of April 7, 2021, a total of 556,106 COVID-19 deaths have been reported, including 871 new deaths.
871
New Deaths Reported
871
New Deaths Reported
711
Current 7-Day Average*
711
Current 7-Day Average*
556,106
Total Deaths Reported
556,106
Total Deaths Reported
895
Prior 7-Day Average
895
Prior 7-Day Average
3,409
Peak of 7-day Average**
3,409
Peak of 7-day Average**
-20.6%
Change in the 7-Day Average Since the Prior Week
-20.6%
Change in the 7-Day Average Since the Prior Week
*Of 13,386 historical deaths reported retroactively, 153 were reported in the current week, and 286 were reported in the prior week.
** The highest peak in the 7-day average of new deaths (Jan 13, 2021).
Note: The table above excludes historical data from the new deaths, the current and previous 7-day averages, and the percent change in the 7-day average.
Daily Trends in Number of COVID-19 Deaths in the United States Reported to CDC

7-Day moving average
Recent COVID Data Tracker Updates
- A new tab in the Genomic Surveillance section displays estimates of SARS-CoV-2 variants in the United States and proportions of SARS-CoV-2 Variants of Concern by State
- Addition of CDC Social Vulnerability Index as a map dropdown option on the County View tab

