Recommendations for Fully Vaccinated People
COVID-19 Homepage

It’s Complicated (but the Basics Still Work)
We are in a complicated stage of the COVID-19 pandemic. Americans are being vaccinated every day at an accelerated pace. As of April 15, 2021, more than 125 million Americans have received at least one dose of vaccine, and more than 78 million Americans are fully vaccinated. And yet, COVID-19 cases and hospitalizations are increasing in some areas of the country, and among younger people who have not yet been vaccinated. The reasons for these increases are complicated but potentially related to emerging SARS-CoV-2 variants that are becoming predominant in some communities.
Nationally, COVID-19-related emergency department visits as well as both hospital admissions and current hospitalizations have risen among patients ages 18 to 64 years in recent weeks. The good news is that emergency department visits and hospitalizations among people ages 65 years and older have decreased, likely demonstrating the important role vaccination plays in protecting against COVID-19. As of April 15, 80% of people 65 years or older have received at least one dose of vaccine and 63.7% are fully vaccinated.
As access to vaccines for all Americans increases, we have reason to be hopeful. However, until more of the U.S. population is fully vaccinated, consistent use of prevention strategies, such as universal and correct use of masks, social distancing, and hand washing, will help to limit the spread of SARS-CoV-2, the virus that causes COVID-19. Even if you have been fully vaccinated against COVID-19, you should keep taking these everyday precautions in public places.
Reported Cases
Overall, the 7-day average of new cases has generally increased since March 20, 2021. The current 7-day moving average of daily new cases (69,577) increased 8.1% compared with the previous 7-day moving average (64,340). Compared with the highest peak on January 11, 2021 (249,861), the current 7-day average decreased 72.2%. A total of 31,231,869 COVID-19 cases were reported as of April 14, 2021, including 73,622 new cases.
73,622
New Cases Reported
73,622
New Cases Reported
69,577
Current 7-Day Average*
69,577
Current 7-Day Average*
31,231,869
Total Cases Reported
31,231,869
Total Cases Reported
64,340
Prior 7-Day Average
64,340
Prior 7-Day Average
249,861
Peak of 7-Day Average**
249,861
Peak of 7-Day Average**
+8.1%
Change in 7-Day Average since Prior Week
+8.1%
Change in 7-Day Average since Prior Week
*Historical cases are excluded from 7-day average calculations. Of 84,466 historical cases reported retroactively (with missing report dates), 6,301 were reported in the current week, and none were reported in the prior week.
**Highest peak for 7-day average (January 11, 2021).
Note: The table above excludes historical data with missing report dates from the new cases, the current and previous 7-day averages, and the percent change in the 7-day average.
Daily Trends in COVID-19 Cases in the United States Reported to CDC

7-Day moving average
SARS-CoV-2 Variants
CDC recently updated the COVID Data Tracker to include the most recent proportions of SARS-CoV-2 variants nationally and in states where there is enough data for CDC to monitor variants. The Variant Surveillance Section of the COVID Data Tracker provides an overview of published sequencing data and a global variant report map by country.
To paint a clearer picture of how prevalent specific variants are in the United States, CDC analyzes available genomic sequence data from specimens of SARS-CoV-2 collected from patients. These data are weighted to account for known differences in diagnostic testing and sequencing across time and geography. Based on specimens collected through March 27, an estimated 44.1% of COVID-19 cases in the United States are caused by the SARS-CoV-2 variant B.1.1.7. The proportion of cases caused by B.1.429 is estimated at 6.9%, and the proportion of cases caused by B.1.427 is estimated at 2.9%. Variant P.1 is estimated to comprise 1.4% of COVID-19 cases, and the proportion of B.1.351 cases is estimated to be 0.7% for the end of March.
CDC and partners are increasing the numbers of specimens sequenced in laboratories around the country. Studies are underway to determine whether variants are more transmissible, cause more severe illness, or are likely to evade immunity brought on by prior illness or vaccination.
Testing
The percentage of COVID-19 RT-PCR tests that are positive (percent positivity) has increased from the previous week. The 7-day average of percent positivity from tests is now 5.6%. The 7-day average test volume for April 2-April 8, 2021, was 1,152,186, down 3.7% from 1,195,920 for the prior 7 days.
394,633,985
Total Tests Reported
394,633,985
Total Tests Reported
1,152,186
7-Day Average Test Volume
1,152,186
7-Day Average Test Volume
5.6%
7-Day Average
% Positivity
5.6%
7-Day Average
% Positivity
+5.1%
Change in 7-Day
% Positivity
+5.1%
Change in 7-Day
% Positivity
COVID-19 Viral (RT-PCR) Laboratory Test 7-day Percent Positivity by State/Territory
Vaccinations
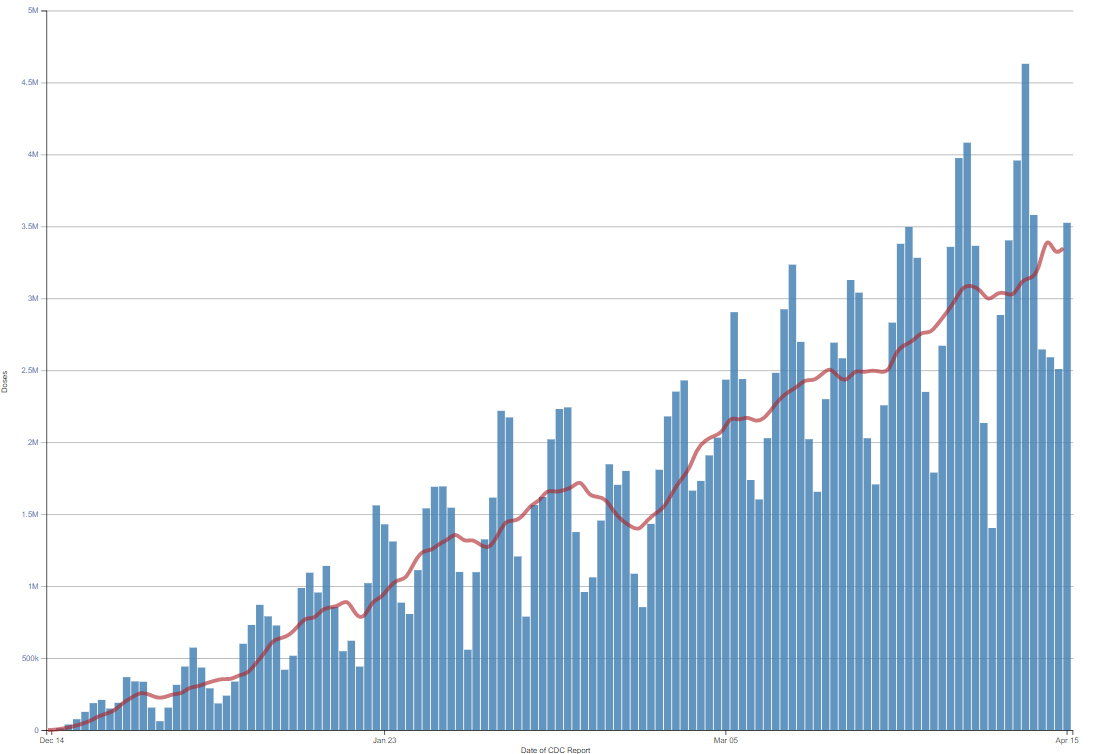
The U.S. COVID-19 Vaccination Program began December 14, 2020. As of April 15, 2021, 198.3 million vaccine doses have been administered. Overall, about 125.8 million people, or 37.9% of the U.S. population, have received at least one dose of vaccine. About 78.5 million people, or 23.6% of the U.S. population, have been fully vaccinated.* As of April 15, the 7-day average number of administered vaccine doses reported to CDC per day was 3.3 million, a 10.3% increase from the previous week.
The COVID Data Tracker Vaccination Demographic Trends tab shows vaccination trends by age group. As of April 15, 80% of people ages 65 or older have received at least one dose of vaccine and 63.7% are fully vaccinated. Nearly one half (48.3%) of people ages 18 or older have received at least one dose of vaccine and 30.3% are fully vaccinated.
198,317,040
Vaccines Administered
198,317,040
Vaccines Administered
125,822,868
People who received at least one dose
125,822,868
People who received at least one dose
78,498,290
People who are fully vaccinated*
78,498,290
People who are fully vaccinated*
37.9%
Percentage of the US population that has received at least one dose
37.9%
Percentage of the US population that has received at least one dose
23.6%
Percentage of the US population that has been fully vaccinated*
23.6%
Percentage of the US population that has been fully vaccinated*
+4.2
percentage point increase from last week
+4.2
percentage point increase from last week
+3.7
percentage point increase from last week
+3.7
percentage point increase from last week
*People who are fully vaccinated (formerly “receiving 2 doses”) represents the number of people who have received the second dose in a two-dose COVID-19 vaccine series or one dose of the single-shot J&J/Janssen COVID-19 vaccine.
Daily Change in Number of COVID-19 Vaccinations in the United States Reported to CDC

7-Day moving average
Hospitalizations
New Hospital Admissions
While new admissions have decreased considerably since their January peaks, the 7-day moving average has now been increasing for approximately 3 weeks. The current 7-day average for April 7–April 13, 2021, was 5,507. This is a 4.5% increase from the prior 7-day average (5,269) from March 31–April 6, 2021.
5,788
New Admissions
5,788
New Admissions
5,507
Current 7-Day Average
5,507
Current 7-Day Average
2,023,259
Total New Admissions
2,023,259
Total New Admissions
5,269
Prior 7-Day Average
5,269
Prior 7-Day Average
16,521
Peak 7-Day Average*
16,521
Peak 7-Day Average*
+4.5%
Change in 7-Day Average
+4.5%
Change in 7-Day Average
*Highest peak for 7-day average (January 9, 2021).
Trends in Hospitalization Rates by Age Group
Older adults are at increased risk for severe COVID-19 illness, including an increased risk for hospitalization. Since the start of the pandemic, adults ages 65 years and older were the age group with the highest rates of COVID-19-associated hospitalization. While rates of hospitalization have fallen for all age groups since the peak in early January 2021, the rates for adults ages 65 years and older have fallen the most. Rates of hospitalization among adults ages 65 years and older have decreased by more than 70% in the past two months, from 70.5 per 100,000 in early January to less than 20 per 100,000 in recent weeks. However, rates have plateaued or risen in recent weeks in all age groups.
Daily Trends in Number of New COVID-19 Hospital Admissions in the United States

The most recent data in the vertical gray bar are provisional and should be interpreted with caution.
New admissions are pulled from a 10 am EST snapshot of the HHS Unified Hospital Timeseries Dataset. Due to potential reporting delays, data from the most recent 7 days should be interpreted with caution. Small shifts in historic data may also occur due to changes in the CMS Provider of Services file, which is used to identify the cohort of included hospitals.
Rates of COVID-19-Associated Hospitalizations

The most recent data in the vertical gray bar are provisional and should be interpreted with caution.
The Coronavirus Disease 2019 (COVID-19)-Associated Hospitalization Surveillance Network (COVID-NET) is an additional source for hospitalization data collected through a network of more than 250 acute-care hospitals in 14 states (representing ~10% of the U.S. population). Detailed data on patient demographics, including race/ethnicity, underlying medical conditions, medical interventions, and clinical outcomes, are collected using a standardized case reporting form.
Deaths
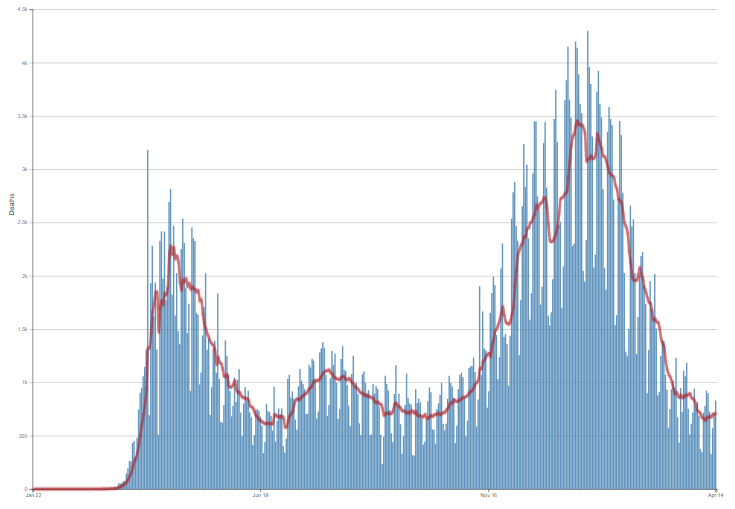
Although the 7-day moving average of daily new deaths has generally decreased for the past 13 weeks, the 7-day average of daily new deaths (712) increased 10.8% compared with the prior 7-day average. As of April 14, 2021, a total of 561,356 COVID-19 deaths have been reported, including 831 new deaths.
831
New Deaths Reported
831
New Deaths Reported
712
Current 7-Day Average*
712
Current 7-Day Average*
561,356
Total Deaths Reported
561,356
Total Deaths Reported
643
Prior 7-Day Average
643
Prior 7-Day Average
3,457
Peak of 7-day Average**
3,457
Peak of 7-day Average**
+10.8%
Change in the 7-Day Average Since the Prior Week
+10.8%
Change in the 7-Day Average Since the Prior Week
*Of 13,580 historical deaths reported retroactively (with missing report dates), 194 were reported in the current week, and 153 were reported in the prior week.
** The highest peak in the 7-day average of new deaths (Jan 13, 2021).
Note: The table above excludes historical data with missing report dates from the new deaths, the current and previous 7-day averages, and the percent change in the 7-day average.
Daily Trends in Number of COVID-19 Deaths in the United States Reported to CDC

7-Day moving average
- Trends in Racial and Ethnic Disparities in COVID-19 Hospitalizations, by Region — United States, March–December 2020
- Emergency Department Visits for COVID-19 by Race and Ethnicity — 13 States, October–December 2020
- Laboratory Modeling of SARS-CoV-2 Exposure Reduction Through Physically Distanced Seating in Aircraft Cabins Using Bacteriophage Aerosol — November 2020
- Joint CDC and FDA Statement on Johnson & Johnson COVID-19 Vaccine | FDAExternal
Recent COVID Data Tracker Updates
- CDC recently updated the COVID Data Tracker to include the most recent proportions of SARS-CoV-2 variants nationally and in states where there is enough data for CDC to monitor variants.


