Recommendations for Fully Vaccinated People
COVID-19 Homepage
The Time is Now
Interpretive Summary for June 3, 2022
The Time is Now

On May 19, 2022, CDC recommended that children ages 5 through 11 years old receive a booster five months after completion of their initial Pfizer-BioNTech COVID-19 vaccination series. This means that everyone ages 5 years and older in the United States is now eligible for a booster.
COVID-19 cases are increasing across the country, yet vaccination rates among children ages 5 through 11 years old continue to lag behind other age groups, which leaves them at increased risk for serious illness. As of June 1, 2022, 35.9% of children ages 5 through 11 years old have received at least one dose of a COVID-19 vaccine, compared to 69.5% of children ages 12 through 17 years old. Since the pandemic began, more than 4.8 million children ages 5 through 11 years old have been diagnosed with COVID-19, 15,000 have been hospitalized, and almost 200 have died.
CDC also strengthened its recommendation that adults ages 50 years and older, as well as those 12 years and older who have weakened immune systems, should get a second booster at least four months after their first. Older Americans have the highest coverage of any age group of first booster doses, but most received their last dose (either their primary series or their first booster dose) many months ago, leaving many without optimal protection against serious illness, hospitalization, and death.
Bottom line: Whether it is your first or second booster, if you haven’t had a vaccine dose since the beginning of December 2021 or earlier and you are eligible, now is the time to get one. CDC developed a tool to help you understand your need for booster doses based on your age, health conditions, and vaccine history. After you use the tool, visit vaccines.gov to find a vaccine provider near you.
- COVID Data Tracker’s Wastewater Surveillance tab now includes a national stacked bar chart showing how much virus levels have changed (increased and decreased) over time at wastewater sites across the United States.
- Post–COVID Conditions Among Adult COVID Survivors Aged 18–64 and ≥65 Years — United States, March 2020–November 2021
- COVID-19 Cases, Hospitalizations, and Deaths among American Indian or Alaska Native Persons — Alaska, 2020–2021
COVID-19 Community Levels
As of June 2, 2022, there are 240 (7.45%) counties, districts, or territories with a high COVID-19 Community Level, 733 (22.76%) counties with a medium Community Level, and 2,247 (69.78%) counties with a low Community Level. This represents a slight (−0.53 percentage points) decrease in the number of high-level counties, a small (+1.37 percentage points) increase in the number of medium-level counties, and a corresponding (−0.84 percentage points) decrease in the number of low-level counties. Fifty-one (98.1%) of 52 jurisdictions had high- or medium-level counties this week.
To check your COVID-19 Community Level, visit COVID Data Tracker. To learn which prevention measures are recommended based on your COVID-19 Community Level, visit COVID-19 Community Level and COVID-19 Prevention.


Reported Cases
As of June 1, 2022, the current 7-day moving average of daily new cases (100,684) decreased 8.5% compared with the previous 7-day moving average (110,081). A total of 84,315,762 COVID-19 cases have been reported in the United States as of June 1, 2022.
CDC Nowcast projections* for the week ending May 28, 2022, estimate the combined national proportion of lineages designated as Omicron to be 100%. There are several lineages of Omicron (B.1.1.529, BA.1, BA.2, BA.3, BA.4, and BA.5), and within each are multiple sublineages. COVID Data Tracker shows the proportions of Omicron lineages grouped as follows: the B.1.1.529 lineage (includes BA.1, BA.3, BA.4, and BA.5), the BA.1.1** lineage, the BA.2 lineage, and the BA.2.12.1 lineage. The predominant Omicron lineage in the United States is BA.2.12.1. The national proportion of BA.2.12.1 is projected to be 59.1% (95% PI 54.7-63.3%). The national proportion of BA.2 is projected to be 34.7% (95% PI 30.8-38.8%). B.1.1.529 (BA.1, BA.3, BA.4 and BA.5) is projected to be 6.1% (95% PI 4.1-8.8%), and BA.1.1 is projected to be 0.1% (95% PI 0.0-0.1%). Omicron is predicted to be 100% in all HHS regions.
84,315,762
Total Cases Reported
84,315,762
Total Cases Reported
100,684
Current 7-Day Average***
100,684
Current 7-Day Average***
110,081
Prior 7-Day Average
110,081
Prior 7-Day Average
-8.5%
Change in 7-Day Average since Prior Week
-8.5%
Change in 7-Day Average since Prior Week
*The median time from specimen collection to sequence data reporting is about 3 weeks. As a result, weighted estimates for the most recent few weeks may be unstable or unavailable. CDC’s Nowcast is a data projection tool that helps fill this gap by generating timely estimates of variant proportions for variants that are circulating in the United States. View Nowcast estimates on CDC’s COVID Data Tracker website on the Variant Proportions page.
**For national data, the proportion of BA.1.1 is shown separately. For regional data, the proportion of BA.1.1 is also aggregated with B.1.1.529.
***Historical cases are excluded from daily new cases and 7-day average calculations until they are incorporated into the dataset for the applicable date. Of 533,663 historical cases reported retroactively, 0 were reported in the current week and 3 were reported in the prior week.
Daily Trends in COVID-19 Cases in the United States Reported to CDC

7-Day moving average

Vaccinations
The U.S. COVID-19 Vaccination Program began December 14, 2020. As of June 1, 2022, 587.8 million vaccine doses have been administered in the United States. Overall, about 258.7 million people, or 77.9% of the total U.S. population, have received at least one dose of vaccine. About 221.4 million people, or 66.7% of the total U.S. population, have been fully vaccinated.* Of those fully vaccinated, about 103.5 million people have received a booster dose,** but 49.0% of the total booster-eligible population has not yet received a booster dose. As of June 1, 2022, the 7-day average number of administered vaccine doses reported (by date of CDC report) to CDC per day was 343,662, a 9.5% decrease from the previous week.
CDC’s COVID Data Tracker displays vaccination trends by age group, race/ethnicity, and urban/rural status. To see trends by age group and race/ethnicity, visit the Vaccination Demographic Trends tab. To see trends by urban/rural status, visit the COVID-19 Vaccination Equity tab.
587,821,662
Vaccine Doses Administered
587,821,662
Vaccine Doses Administered
258,655,540
People who received at least one dose
258,655,540
People who received at least one dose
221,350,544
People who are fully vaccinated*
221,350,544
People who are fully vaccinated*
77.9%
Percentage of the U.S. population that has received at least one dose
77.9%
Percentage of the U.S. population that has received at least one dose
66.7%
Percentage of the U.S. population that has been fully vaccinated*
66.7%
Percentage of the U.S. population that has been fully vaccinated*
+0.2
Percentage point increase from last week
+0.2
Percentage point increase from last week
+0.2
Percentage point increase from last week
+0.2
Percentage point increase from last week
*Represents the number of people who have received the second dose in a two-dose COVID-19 vaccine series (such as the Pfizer-BioNTech or Moderna vaccines) or one dose of the single-shot Johnson & Johnson’s Janssen vaccine.
**Represents the number of people who are fully vaccinated and have received another dose of COVID-19 vaccine since August 13, 2021. This includes people who received their first additional dose or booster dose.
Daily Change in the Total Number of Administered COVID-19 Vaccine Doses Reported to CDC by the Date of CDC Report, United States
7-Day moving average

Hospitalizations
New Hospital Admissions
The current 7-day daily average for May 25–31, 2022, was 3,789. This is a 4.7% increase from the prior 7-day average (3,619) from May 18–24, 2022.
4,745,738
Total New Admissions
4,745,738
Total New Admissions
3,789
Current 7-Day Average
3,789
Current 7-Day Average
3,619
Prior 7-Day Average
3,619
Prior 7-Day Average
+4.7%
Change in 7-Day Average
+4.7%
Change in 7-Day Average
The start of consistent reporting of hospital admissions data was August 1, 2020.
Daily Trends in Number of New COVID-19 Hospital Admissions in the United States

New admissions are pulled from a 10 am EDT snapshot of the HHS Unified Hospital Data – Analytic Dataset. Due to potential reporting delays, data from the most recent 7 days, as noted in the figure above with the grey bar, should be interpreted with caution. Small shifts in historic data may also occur due to changes in the Centers for Medicare & Medicaid Services (CMS) Provider of Services file, which is used to identify the cohort of included hospitals.
COVID-NET: Hospitalization Rates among Adults Ages 65 Years and Older
CDC’s Coronavirus Disease 2019-Associated Hospitalization Surveillance Network (COVID-NET) shows that overall rates of COVID-19-associated hospitalizations have increased since the week ending April 2, 2022. Notably, adults ages 65 years and older have seen the sharpest increase in rates, from 6.7 per 100,000 population on April 2, to 24.3 per 100,000 population on May 14. Among this group, older adults ages 85 and older have had the largest increase in hospitalization rates, increasing from 14.8 per 100,000 population on April 2, to 68.7 per 100,000 population on May 14.
Hospitalization Rates among Adults Ages 65 Years and Older

The Coronavirus Disease 2019 (COVID-19)-Associated Hospitalization Surveillance Network (COVID-NET) is an additional source for hospitalization data collected through a network of more than 250 acute-care hospitals in 14 states (representing ~10% of the U.S. population). Detailed data on patient demographics, including race/ethnicity, underlying medical conditions, medical interventions, and clinical outcomes, are collected using a standardized case reporting form.
Deaths
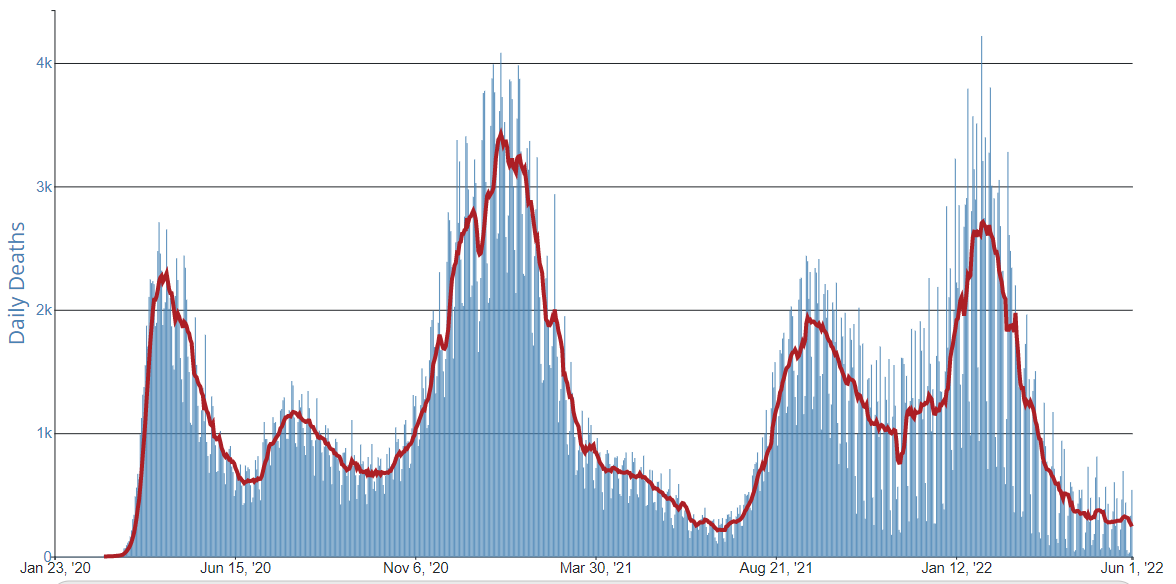
The current 7-day moving average of new deaths (244) has decreased 23.1% compared with the previous 7-day moving average (318). As of June 1, 2022, a total of 1,002,993 COVID-19 deaths have been reported in the United States.
1,002,993
Total Deaths Reported
1,002,993
Total Deaths Reported
244
Current 7-Day Average*
244
Current 7-Day Average*
318
Prior 7-Day Average
318
Prior 7-Day Average
-23.1%
Change in 7-Day Average Since Prior Week
-23.1%
Change in 7-Day Average Since Prior Week
*Historical deaths are excluded from the daily new deaths and 7-day average calculations until they are incorporated into the dataset by their applicable date. Of 21,705 historical deaths reported retroactively, 133 were reported in the current week; and 154 were reported in the prior week.
Daily Trends in Number of COVID-19 Deaths in the United States Reported to CDC
7-Day moving average
 More Death Data
Testing
The percentage of COVID-19 NAATs (nucleic acid amplification tests)* that are positive (percent positivity) is increasing in comparison to the previous week. The 7-day average of percent positivity from NAATs is now 11.7%. The 7-day average number of tests reported for May 20-May 26, 2022, was 855,184, down 2.4% from 876,467 for the prior 7 days.
894,951,691
Total Tests Reported
894,951,691
Total Tests Reported
855,184
7-Day Average Tests Reported
855,184
7-Day Average Tests Reported
11.7%
7-Day Average % Positivity
11.7%
7-Day Average % Positivity
11.0%
Previous 7-Day Average % Positivity
11.0%
Previous 7-Day Average % Positivity
+0.74
Percentage point change in 7-Day Average % Positivity since Prior Week
+0.74
Percentage point change in 7-Day Average % Positivity since Prior Week
*Test for SARS-CoV-2, the virus that causes COVID-19
COVID-19 NAAT Laboratory Test 7-day Percent Positivity by State/Territory

Wastewater Surveillance
COVID Data Tracker’s Wastewater Surveillance tab tracks levels, changes, and detections of SARS-CoV-2* viral RNA in wastewater at nearly 900 testing sites across the country.
Currently, most of the country is reporting moderate SARS-CoV-2 levels in wastewater. Around 32% of sites are currently seeing some of the highest levels for those sites since December 1, 2021. Additionally, more than half of all sites reporting wastewater data are experiencing a modest increase in SARS-CoV-2 levels, but about 40% of sites are reporting a decrease in SARS-CoV-2 levels in wastewater. It’s important to note that even a small increase when levels are low can appear like a dramatic increase in the percent change.
This week, a Wastewater Metric Chart was added to COVID Data Tracker’s Wastewater Surveillance page. This chart shows how virus levels in wastewater have increased or decreased across the United States since January 2021. For more information on how to use wastewater data, visit CDC’s National Wastewater Surveillance System website.
*The virus that causes COVID-19
SARS-CoV-2 Levels in Wastewater by Site

0% means levels are the lowest they have been at the site; 100% means levels are the highest they have been at the site.