Recommendations for Fully Vaccinated People
COVID-19 Homepage
Cases Rising: Get Boosted
Interpretive Summary for July 22, 2022
Cases Rising: Get Boosted
This week, COVID-19 cases, deaths, and hospitalizations are on the rise in the United States, driving COVID-19 Community Levels up to medium or high in 75% of counties. Omicron BA.5 is the predominant variant, causing an estimated 78% of cases. BA.5 has fueled the rapid rise in cases since June, suggesting that it spreads more easily than previous Omicron lineages.
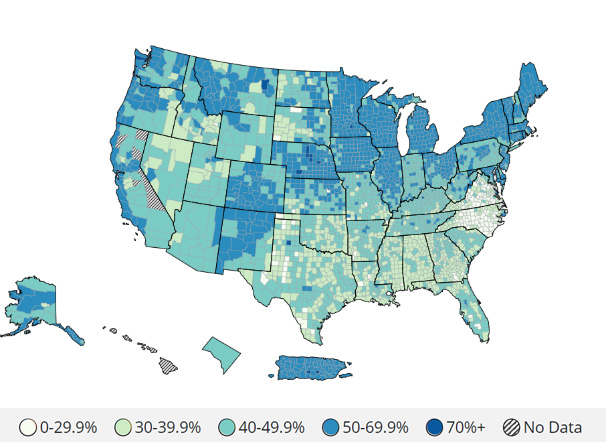
According to CDC’s COVID Data Tracker, only about 34% of people who are eligible for a COVID-19 booster and about 29% of people ages 50 years and older who are eligible for a second booster have gotten one. Booster vaccination rates vary widely across the United States. In the Northeast and parts of the Midwest, 50% to 70% of eligible people have gotten a first booster in almost every county. Unfortunately, much of the Southeast and Southwest are in the 30% to 40% range. This means millions of people are not fully protected because they are not up to date on their COVID-19 vaccines. Both the rise in cases and the gradual decrease in vaccine protection since your last shot make it an especially important time to get up to date on COVID-19 vaccines.
Our communities are safest when we work together to protect everyone. If you live in an area with low vaccine coverage, you can help by encouraging others to get up to date on their COVID-19 vaccines. You can use the following resources to:
- Talk About COVID-19 Vaccines With Friends and Family.
- Address Myths and Facts about COVID-19 Vaccines with someone who has fears or concerns about COVID-19 vaccines.
- Point people to vaccines.gov if they still need a primary series vaccine or a booster.
- The Nationwide Commercial Lab Pediatric Antibody Seroprevalence tab provides estimates of the U.S. pediatric population (ages 6 months to 17 years) with evidence of antibodies from at least one resolving or past infection with SARS-CoV-2, the virus that causes COVID-19.
COVID-19 Community Levels
As of July 21, 2022, there are 1,350 (41.9%) counties, districts, or territories with a high COVID-19 Community Level, 1,212 (37.6%) counties with a medium Community Level, and 658 (20.4%) counties with a low Community Level. Compared with last week, this represents an increase (+6.5 percentage points) in the number of high-level counties, a decrease (−2.0) percentage points) in the number of medium-level counties, and a corresponding decrease (−4.5) percentage points) in the number of low-level counties. 50 out of 52 jurisdictions* had high- or medium-level counties this week. Rhode Island and Maine are the only jurisdictions to have all counties at low Community Levels.
To check your COVID-19 Community Level, visit COVID Data Tracker. To learn which prevention measures are recommended based on your COVID-19 Community Level, visit COVID-19 Community Level and COVID-19 Prevention.
*Includes the 50 states, the District of Columbia, and Puerto Rico.


Reported Cases
As of July 20, 2022, the current 7-day moving average of daily new cases (125,827) increased 0.5% compared with the previous 7-day moving average (125,185). A total of 89,824,190 COVID-19 cases have been reported in the United States as of July 20, 2022.
Variant Proportions
CDC Nowcast projections* for the week ending July 16, 2022, estimate that the combined national proportion of lineages designated as Omicron will continue to be 100% with the predominant Omicron lineage being BA.5, projected at 77.9% (95% PI 75.8-79.9%).
There are several lineages of Omicron and within each are multiple sublineages. The national proportion of BA.4 is projected to be 12.8% (95% PI 11.3-14.4%), BA.2.12.1 is projected to be 8.6% (95% PI 7.8-9.5%), and BA.2 is projected to be 0.6% (95% PI 0.6-0.7%). See COVID Data Tracker for current data.
89,824,190
Total Cases Reported
89,824,190
Total Cases Reported
125,827
Current 7-Day Average**
125,827
Current 7-Day Average**
125,185
Prior 7-Day Average
125,185
Prior 7-Day Average
0.5%
Change in 7-Day Average since Prior Week
0.5%
Change in 7-Day Average since Prior Week
*The median time from specimen collection to sequence data reporting is about 3 weeks. As a result, weighted estimates for the most recent few weeks may be unstable or unavailable. CDC’s Nowcast is a data projection tool that helps fill this gap by generating timely estimates of variant proportions for variants that are circulating in the United States. View Nowcast estimates on CDC’s COVID Data Tracker website on the Variant Proportions page.
**Historical cases are excluded from daily new cases and 7-day average calculations until they are incorporated into the dataset for the applicable date. Of 536,352 historical cases reported retroactively, none were reported in the current week and none were reported in the prior week.
Daily Trends in COVID-19 Cases in the United States Reported to CDC

7-Day moving average

Vaccinations
The U.S. COVID-19 Vaccination Program began December 14, 2020. As of July 20, 2022, 601.5 million vaccine doses have been administered in the United States. Overall, about 261.2 million people, or 78.7% of the total U.S. population, have received at least one dose of vaccine. About 223.0 million people, or 67.2% of the total U.S. population, have been fully vaccinated.* Of those fully vaccinated, about 107.5 million people have received a booster dose,** but 50.2% of the total booster-eligible population has not yet received a booster dose.
CDC’s COVID Data Tracker displays vaccination trends by age group, race/ethnicity, and urban/rural status. To see trends by age group and race/ethnicity, visit the Vaccination Demographic Trends tab. To see trends by urban/rural status, visit the COVID-19 Vaccination Equity tab.
601,497,801
Vaccine Doses Administered
601,497,801
Vaccine Doses Administered
261,204,035
People who received at least one dose
261,204,035
People who received at least one dose
222,950,194
People who are fully vaccinated*
222,950,194
People who are fully vaccinated*
78.7%
Percentage of the U.S. population that has received at least one dose
78.7%
Percentage of the U.S. population that has received at least one dose
67.2%
Percentage of the U.S. population that has been fully vaccinated*
67.2%
Percentage of the U.S. population that has been fully vaccinated*
+0.2
Percentage point increase from last week
+0.2
Percentage point increase from last week
+0.1
Percentage point change from last week
+0.1
Percentage point change from last week
*Represents the number of people who have received the second dose in a two-dose COVID-19 vaccine series (such as the Pfizer-BioNTech or Moderna vaccines) or one dose of the single-shot Johnson & Johnson’s Janssen vaccine.
**Represents the number of people who are fully vaccinated and have received another dose of COVID-19 vaccine since August 13, 2021. This includes people who received their first additional dose or booster dose.
Daily Change in the Total Number of Administered COVID-19 Vaccine Doses Reported to CDC by the Date of CDC Report, United States
7-Day moving average

Hospitalizations
New Hospital Admissions
The current 7-day daily average for July 13–19, 2022, was 6,180. This is a 4.7% increase from the prior 7-day average (5,902) from July 6–12, 2022.
4,991,074
Total New Admissions
4,991,074
Total New Admissions
6,180
Current 7-Day Average
6,180
Current 7-Day Average
5,902
Prior 7-Day Average
5,902
Prior 7-Day Average
+4.7%
Change in 7-Day Average
+4.7%
Change in 7-Day Average
The start of consistent reporting of hospital admissions data was August 1, 2020.
Daily Trends in Number of New COVID-19 Hospital Admissions in the United States

New admissions are pulled from a 10 am EDT snapshot of the HHS Unified Hospital Data – Analytic Dataset. Due to potential reporting delays, data from the most recent 7 days, as noted in the figure above with the grey bar, should be interpreted with caution. Small shifts in historic data may also occur due to changes in the Centers for Medicare & Medicaid Services (CMS) Provider of Services file, which is used to identify the cohort of included hospitals.
COVID-NET: Trends in Hospitalizations among Adults Ages ≥65 Years
CDC’s Coronavirus Disease 2019-Associated Hospitalization Surveillance Network (COVID-NET) shows that since the start of the pandemic, adults ages 65 years and older have often accounted for the largest percentage of COVID-19-associated hospitalizations. Beginning in April 2022, the proportion of cases in older adults began to increase. From April 7 through July 16, 2022, adults ages 65 years and older have accounted for more than half of all COVID-19-associated hospitalizations, peaking at 57.2% of all hospitalizations for the week ending May 7.
Trends in COVID-19-Associated Hospitalizations among Adults Ages ≥65 Years

The Coronavirus Disease 2019 (COVID-19)-Associated Hospitalization Surveillance Network (COVID-NET) is an additional source for hospitalization data collected through a network of more than 250 acute-care hospitals in 14 states (representing ~10% of the U.S. population). Detailed data on patient demographics, including race/ethnicity, underlying medical conditions, medical interventions, and clinical outcomes, are collected using a standardized case reporting form.
Deaths
The current 7-day moving average of new deaths (348) has decreased 9.5% compared with the previous 7-day moving average (384). As of July 20, 2022, a total of 1,021,048 COVID-19 deaths have been reported in the United States.
1,021,048
Total Deaths Reported
1,021,048
Total Deaths Reported
348
Current 7-Day Average*
348
Current 7-Day Average*
384
Prior 7-Day Average
384
Prior 7-Day Average
-9.5%
Change in 7-Day Average Since Prior Week
-9.5%
Change in 7-Day Average Since Prior Week
*Historical deaths are excluded from the daily new deaths and 7-day average calculations until they are incorporated into the dataset by their applicable date. Of 21,756 historical deaths reported retroactively, none were reported in the current week; and none were reported in the prior week.
Daily Trends in Number of COVID-19 Deaths in the United States Reported to CDC
7-Day moving average
 More Death Data
Testing
The percentage of COVID-19 NAATs (nucleic acid amplification tests)* that are positive (percent positivity) is decreasing in comparison to the previous week. The 7-day average of percent positivity from NAATs is now 17.3%. The 7-day average number of tests reported for July 8–14, 2022, was 553,132, up 4.0% from 532,000 for the prior 7 days.
925,534,224
Total Tests Reported
925,534,224
Total Tests Reported
553,132
7-Day Average Tests Reported
553,132
7-Day Average Tests Reported
17.3%
7-Day Average % Positivity
17.3%
7-Day Average % Positivity
17.6%
Previous 7-Day Average % Positivity
17.6%
Previous 7-Day Average % Positivity
-0.30
Percentage point change in 7-Day Average % Positivity since Prior Week
-0.30
Percentage point change in 7-Day Average % Positivity since Prior Week
*Test for SARS-CoV-2, the virus that causes COVID-19
COVID-19 NAAT Laboratory Test 7-day Percent Positivity by State/Territory

Wastewater Surveillance
COVID Data Tracker’s Wastewater Surveillance tab tracks levels, changes, and detections of SARS-CoV-2* viral RNA in wastewater at over 1,000 testing sites across the country.
Currently, most of the country is reporting moderate to high SARS-CoV-2 levels in wastewater. Around 49% of sites are currently seeing some of the highest levels for those sites since December 1, 2021. About 48% of all sites reporting wastewater data are experiencing a decrease in SARS-CoV-2 levels, and about 43% are reporting an increase. It’s important to note that even a small increase when levels are low can appear like a dramatic increase in the percent change.
For more information on how to use wastewater data visit CDC’s website.
*The virus that causes COVID-19
SARS-CoV-2 Levels in Wastewater by Site


0% means levels are the lowest they have been at the site; 100% means levels are the highest they have been at the site.