Recommendations for Fully Vaccinated People
COVID-19 Homepage

Don’t Run Down the Shot Clock
Interpretive Summary for July 30, 2021
Don’t Run Down the Shot Clock
COVID-19 cases, hospitalizations, and deaths are once again increasing in nearly all states, fueled by the B.1.617.2 (Delta) variant, which is much more contagious than past versions of the virus. The highest spread of cases and severe outcomes is happening in places with low vaccination rates. Although COVID-19 vaccination is the most effective prevention measure, vaccination rates across the United States have varied.
COVID-19 vaccines are very effective, but no vaccine is perfect. In some instances, fully vaccinated people will get COVID-19 and may be contagious. These are called “vaccine breakthrough cases.” A new CDC study finds that B.1.617.2 (Delta) can lead to breakthrough infections. This means that while vaccinated people are much less likely to get sick, it will still happen in some cases. As the number of people who are vaccinated goes up, the number of breakthrough cases is also expected to increase, even as the vaccines remain highly effective.
Vaccines help protect people from getting COVID-19 or from getting severely ill from it. Unvaccinated people should get vaccinated and continue masking. CDC also recommends that fully vaccinated people wear masks in public indoor settings in areas of substantial or high transmission. With the B.1.617.2 (Delta) variant rapidly spreading throughout the country, this is more urgent than ever. To find a vaccine provider near you, visit Vaccines.gov or your state or local public health department website. If you or someone you know is hesitant about COVID-19 vaccination, CDC has information and answers to frequently asked questions to help them inform their decision.
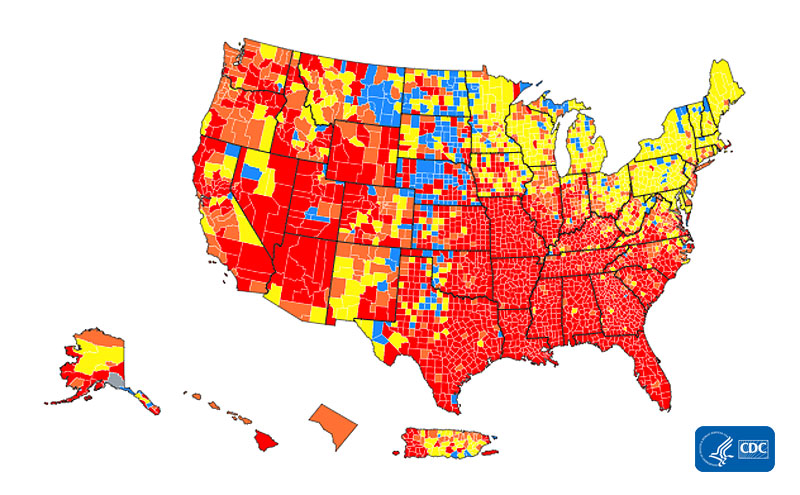
Note to readers: On July 27, 2021, CDC announced updated Guidance for COVID-19 Prevention Strategies. Among strategies to prevent COVID-19, CDC recommends all unvaccinated people wear masks in public indoor settings. Based on emerging evidence of the B.1.617.2 (Delta) variant, CDC also recommends that fully vaccinated people wear masks in public indoor settings in areas of substantial or high transmission. To see the level of community transmission in your county, visit COVID Data Tracker.
Reported Cases
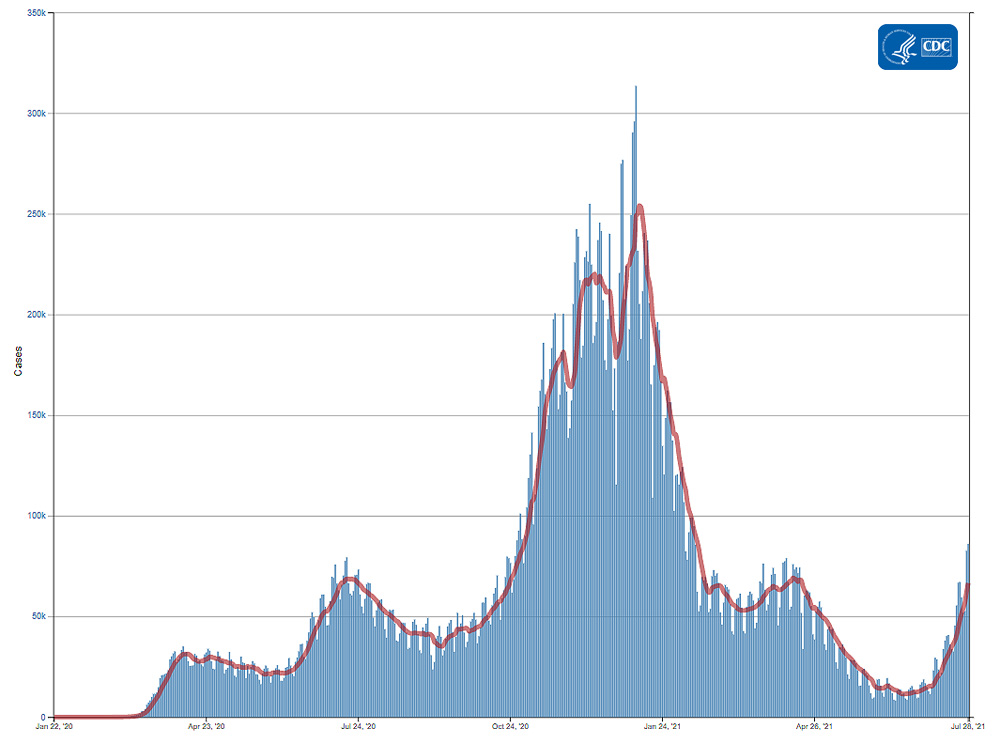
The current 7-day moving average of daily new cases (66,606) increased 64.1% compared with the previous 7-day moving average (40,597). The current 7-day moving average is 73.8% lower than the peak observed on January 10, 2021 (254,063) and is 480.1% higher than the lowest value observed on June 19, 2021 (11,483). A total of 34,722,631 COVID-19 cases have been reported as of July 28.
34,722,631
Total Cases Reported
34,722,631
Total Cases Reported
66,606
Current 7-Day Average*
66,606
Current 7-Day Average*
40,597
Prior 7-Day Average
40,597
Prior 7-Day Average
+64.1%
Change in 7-Day Average since Prior Week
+64.1%
Change in 7-Day Average since Prior Week
*Historical cases are excluded from daily new cases and 7-day average calculations until they are incorporated into the dataset for the applicable date. Of 77,785 historical cases reported retroactively, 2,086 were reported in the current week and 1,469 were reported in the prior week.
Daily Trends in COVID-19 Cases in the United States Reported to CDC

7-Day moving average
SARS-CoV-2 Variants
Multiple variants of the virus that causes COVID-19 are circulating globally, including within the United States. Currently, four variants are classified as a variant of concern (VOC). Nowcast estimates* of SARS-CoV-2 cases caused by these VOCs for the two weeks ending July 17 are summarized here. Nationally, the proportion of cases attributed to B.1.617.2 (Delta) is predicted to increase to 82.2%; B.1.1.7 (Alpha) proportion is predicted to decrease to 9.0%; P.1 (Gamma) proportion is predicted to decrease to 3.8%; and B.1.351 (Beta) is predicted to remain steady at 0.1%. Nowcast estimates predict that B.1.617.2 (Delta) will continue to be the predominant lineage circulating in all HHS regions and be more than 70% in nine HHS regions. B.1.1.7 (Alpha) is predicted to be less than or equal to 21% in all HHS regions. P.1 (Gamma) is predicted to be less than 9% in all HHS regions; and B.1.351 (Beta) is predicted to be less than or equal to 0.2% in all HHS regions.
*The median time from specimen collection to sequence data reporting is about 3 weeks. As a result, weighted estimates for the most recent few weeks may be unstable or unavailable. CDC’s Nowcast is a data projection tool that helps fill this gap by generating timely estimates of variant proportions for variants that are circulating in the United States. View Nowcast estimates on CDC’s COVID Data Tracker website on the Variant Proportions page.
Testing
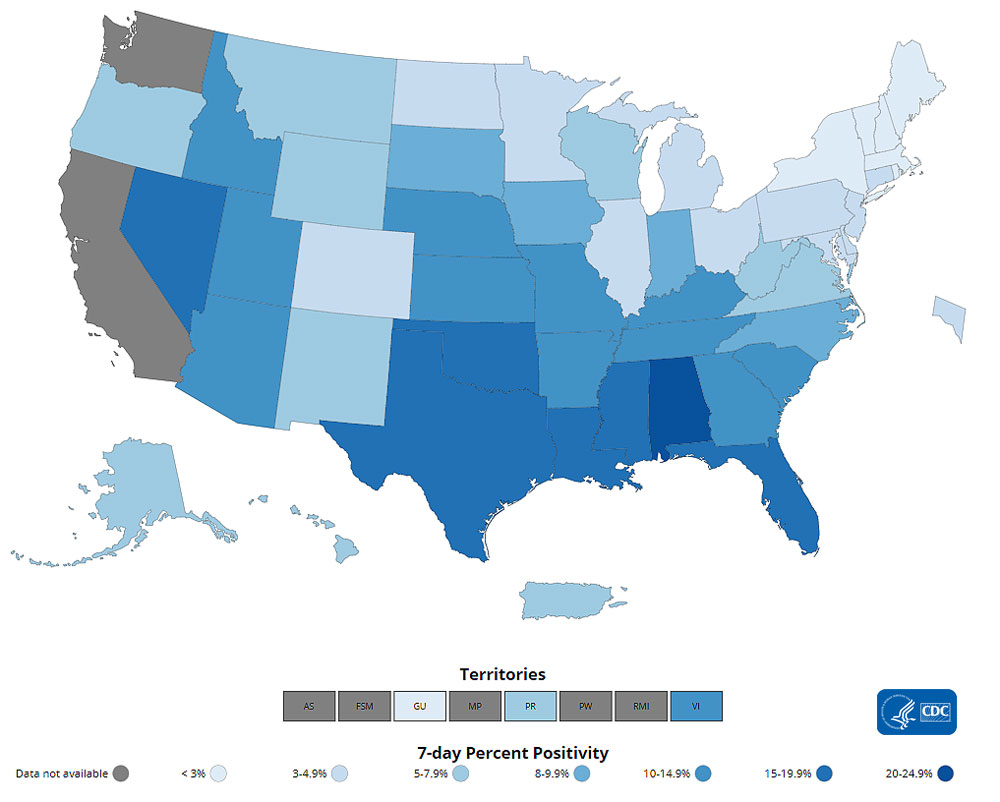
The percentage of COVID-19 NAATs (nucleic acid amplification tests) that are positive (percent positivityExternal) has increased from the previous week. The 7-day average of percent positivity from tests is now 7.8%. The 7-day average number of tests reported for July 16 – Jul 22 was 698,611 up 14.5% from 610,004 for the prior 7 days.
486,000,511
Total Tests Reported
486,000,511
Total Tests Reported
698,611
7-Day Average Tests Reported
698,611
7-Day Average Tests Reported
7.8%
7-Day Average % Positivity
7.8%
7-Day Average % Positivity
6.0%
Previous 7-Day Average % Positivity
6.0%
Previous 7-Day Average % Positivity
+31.0%
Change in 7-Day Average % Positivity since Prior Week
+31.0%
Change in 7-Day Average % Positivity since Prior Week
COVID-19 NAAT Laboratory Test 7-day Percent Positivity by State/Territory
Vaccinations
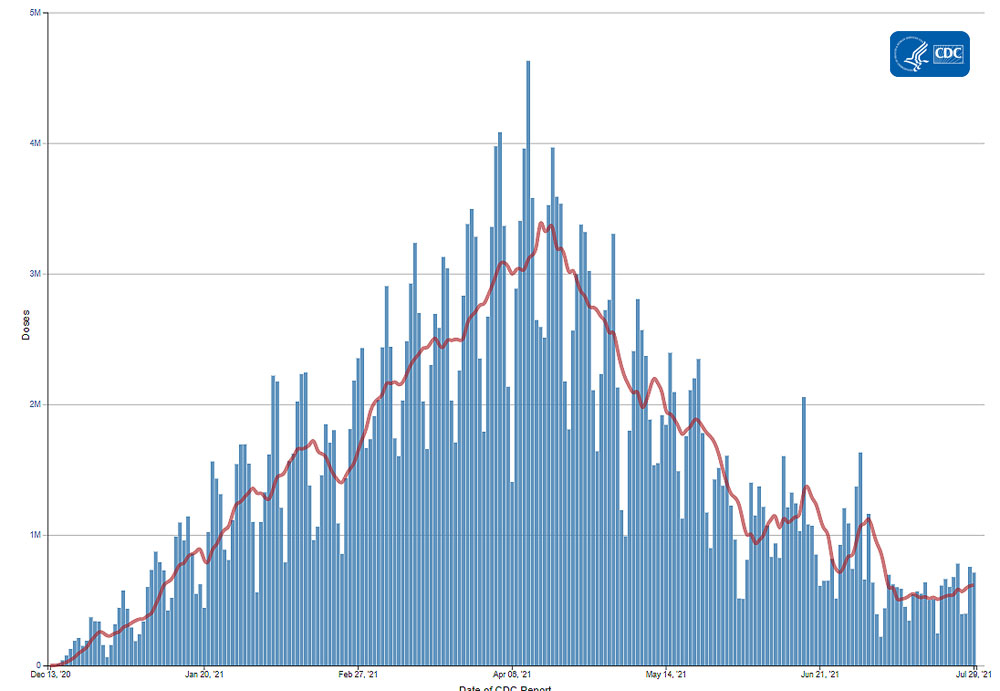
The U.S. COVID-19 Vaccination Program began December 14, 2020. As of July 29, 344.1 million vaccine doses have been administered. Overall, about 189.9 million people, or 57.2% of the total U.S. population, have received at least one dose of vaccine. About 163.9 million people, or 49.4% of the total U.S. population, have been fully vaccinated.* As of July 29, the 7-day average number of administered vaccine doses reported (by date of CDC report) to CDC per day was 615,404, a 16.15% increase from the previous week.
CDC’s COVID Data Tracker Vaccination Demographic Trends tab shows vaccination trends by age group. As of July 29, 89.7% of people ages 65 or older have received at least one dose of vaccine and 79.9% are fully vaccinated. Over two-thirds (69.4%) of people ages 18 or older have received at least one dose of vaccine and 60.3% are fully vaccinated. For people ages 12 or older, 66.9% have received at least one dose of vaccine and 57.7% are fully vaccinated.
344,071,595
Vaccines Administered
344,071,595
Vaccines Administered
189,945,907
People who received at least one dose
189,945,907
People who received at least one dose
163,868,916
People who are fully vaccinated*
163,868,916
People who are fully vaccinated*
57.2%
Percentage of the US population that has received at least one dose
57.2%
Percentage of the US population that has received at least one dose
49.4%
Percentage of the US population that has been fully vaccinated*
49.4%
Percentage of the US population that has been fully vaccinated*
+0.8
Percentage point increase from last week
+0.8
Percentage point increase from last week
+0.6
Percentage point increase from last week
+0.6
Percentage point increase from last week
*People are considered fully vaccinated 2 weeks after their second dose in a 2-dose series (such as the Pfizer or Moderna vaccines), or 2 weeks after a single-dose vaccine (such as Johnson & Johnson’s Janssen vaccine).
Daily Change in the Total Number of Administered Doses Reported to CDC by the date of CDC Report, United States

7-Day moving average
Hospitalizations
New Hospital Admissions
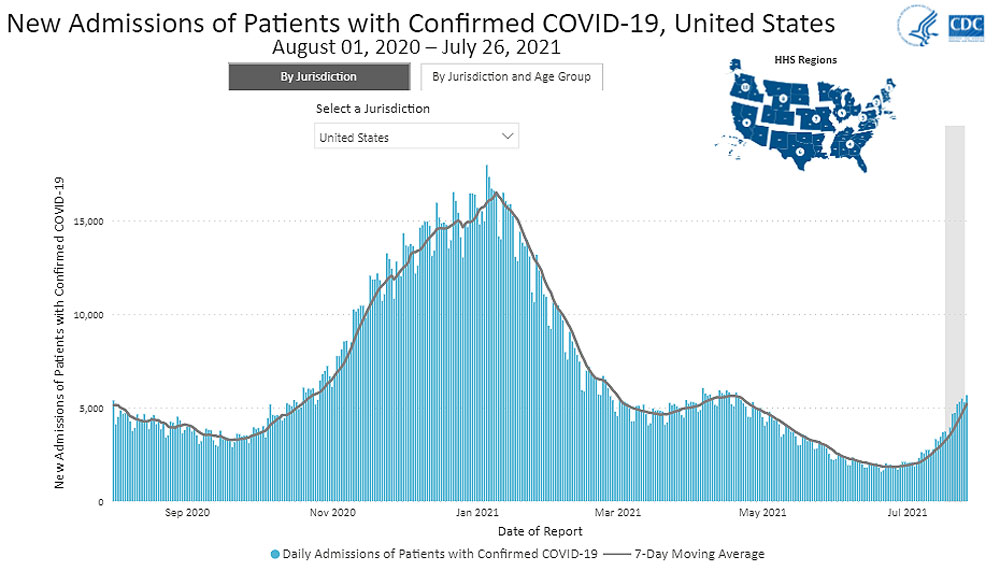
The current 7-day average for July 21–July 27 was 5,475. This is a 46.3% increase from the prior 7-day average (3,742) from July 14–July 20. The 7-day moving average for new admissions has consistently increased since June 25, 2021.
2,381,644
Total New Admissions
2,381,644
Total New Admissions
5,475
Current 7-Day Average
5,475
Current 7-Day Average
3,742
Prior 7-Day Average
3,742
Prior 7-Day Average
+46.3%
Change in 7-Day Average
+46.3%
Change in 7-Day Average
The start of consistent reporting of hospital admissions data was August 1, 2020.
Daily Trends in Number of New COVID-19 Hospital Admissions in the United States
New admissions are pulled from a 10 am EST snapshot of the HHS Unified Hospital Timeseries Dataset. Due to potential reporting delays, data from the most recent 7 days, as noted in the figure above with the grey bar, should be interpreted with caution. Small shifts in historic data may also occur due to changes in the CMS Provider of Services file, which is used to identify the cohort of included hospitals.
COVID-NET: Trends in Hospitalizations in Adults Ages 18–49 Years
CDC’s Coronavirus Disease 2019-Associated Hospitalization Surveillance Network (COVID-NET) shows that hospitalization rates are increasing in younger adults. While adults ages 65 years and older are most at-risk, younger adults are also at risk for COVID-19-associated hospitalizations. Rates of hospitalization remain low when compared to previous months of the pandemic, but preliminary data show that weekly rates of COVID-19-associated hospitalizations have increased significantly for adults ages 18 to 49 years. Compared to June 26, 2021, weekly rates in adults ages 18–49 years for the week ending July 10, 2021 have increased by nearly 40%. These are the first increases in rates of COVID-19-associated hospitalizations seen in this age group since April 2021.
Trends in Rates of COVID-19-Associated Hospitalizations in Adults Ages 18–49 Years
The Coronavirus Disease 2019 (COVID-19)-Associate¬¬d Hospitalization Surveillance Network (COVID-NET) is an additional source for hospitalization data collected through a network of more than 250 acute-care hospitals in 14 states (representing ~10% of the U.S. population). Detailed data on patient demographics, including race/ethnicity, underlying medical conditions, medical interventions, and clinical outcomes, are standardized case reporting form.
Deaths
The current 7-day moving average of new deaths (296) has increased 33.3% compared with the previous 7-day moving average (222). The current 7-day moving average is 91.8% lower than the peak observed on January 13, 2021 (3,625) and is 77.1% higher than the lowest value observed on July 10, 2021 (167). As of July 28, a total of 609,853 COVID-19 deaths have been reported.
609,853
Total Deaths Reported
609,853
Total Deaths Reported
296
Current 7-Day Average*
296
Current 7-Day Average*
222
Prior 7-Day Average
222
Prior 7-Day Average
+33.3%
Change in 7-Day Average Since Prior Week
+33.3%
Change in 7-Day Average Since Prior Week
*Historical deaths are excluded from the daily new deaths and 7-day average calculations until they are incorporated into the dataset by their applicable date. Of 6,143 historical deaths reported retroactively, 26 were reported in the current week and 8 were reported in the prior week.
Daily Trends in Number of COVID-19 Deaths in the United States Reported to CDC

7-Day moving average
- Guidance for Implementing COVID-19 Prevention Strategies in the Context of Varying Community Transmission Levels and Vaccination Coverage
- SARS-CoV-2 Infection in Public School District Employees Following a District-Wide Vaccination Program — Philadelphia County, Pennsylvania, March 21–April 23, 2021
- Disparities in COVID-19 Vaccination Coverage Among Health Care Personnel Working in Long-Term Care Facilities, by Job Category, National Healthcare Safety Network — United States, March 2021
- Outbreak of SARS-CoV-2 Infections, including COVID-19 Vaccine Breakthrough Infections, Associated with Large Public Gatherings — Barnstable County, Massachusetts, July 2021
Recent COVID Data Tracker Updates
- The Vaccination Trends tab now displays trends by state and jurisdiction
- The Vaccination Among Pregnant People tab displays the percent of pregnant people ages 18-49 years receiving at least one dose of a COVID-19 vaccine during pregnancy overall and by race/ethnicity
- The Vaccine Confidence tab allows users to explore trends in vaccine confidence in the United States by visualizing trends in vaccination status and intent by week and by demographics
