Recommendations for Fully Vaccinated People
COVID-19 Homepage

Put on Your Masks and Thinking Caps
Interpretive Summary for August 13, 2021
Put on Your Masks and Thinking Caps
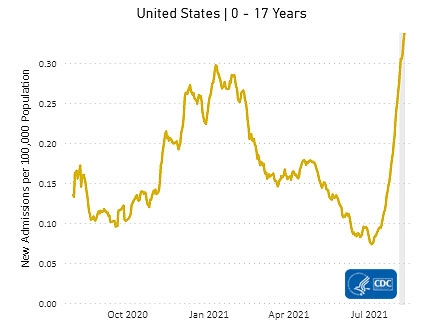
COVID-19 cases, hospitalizations, and deaths continue to increase, especially in areas with higher levels of community transmission and lower vaccination coverage. Pediatric cases and hospitalizations have also increased in recent weeks. Rates of COVID-19-associated hospitalizations are lower in children of all ages compared to adults, but some children develop acute COVID-19 requiring hospitalization.1 In addition, some children who have had COVID-19 may later develop Multisystem Inflammatory Syndrome in Children (MIS-C), a rare but serious condition associated with COVID-19. As of July 30, 2021, CDC has received reports of more than 4,400 children in the United States who have been diagnosed with COVID-19-associated MIS-C.
Because children can be affected by COVID-19 and severe complications can occur, schools are encouraged to implement CDC’s updated Guidance for COVID-19 Prevention in K – 12 Schools to keep children safe. CDC’s updated guidance recommends that schools implement layered prevention strategies, including universal masking by all students ages 2 years and older, staff, teachers, and visitors, regardless of vaccination status. CDC also recommends eligible students, parents, teachers, and staff get vaccinated as soon as possible. Vaccination among eligible populations is critical to stopping the spread of COVID-19, especially to children under the age of 12 who are not yet eligible for vaccination.
Trends in New Hospital Admissions in Children Ages 0–17 Years
Schools can safely reopen by implementing safety precautions. During previous COVID-19-related school closures, many children lost access to important services, including school-based healthcare services, special services for students with disabilities, physical education, and nutrition programs. School closures also contributed to increased anxiety and loneliness in many children and teens.2,3,4 Schools provide safe environments for learning and support healthy peer interaction important for social and emotional development. Children benefit from in-person learning, and safely returning to in-person instruction in the fall 2021 is a priority.
Note to readers: The COVID-19 pandemic has had a major effect on our lives. Many of us are facing challenges that can be stressful and overwhelming, and that can cause strong emotions in adults and children. Learning to cope with stress in a healthy way will make you, the people you care about, and those around you become more resilient. CDC has resources to help children, teens and young adults cope with stress. The CDC Parental Resources Kit helps support parents, caregivers, and other adults serving children and young people in recognizing children and young people’s social, emotional, and mental health challenges and helping to ensure their well-being.
Reported Cases
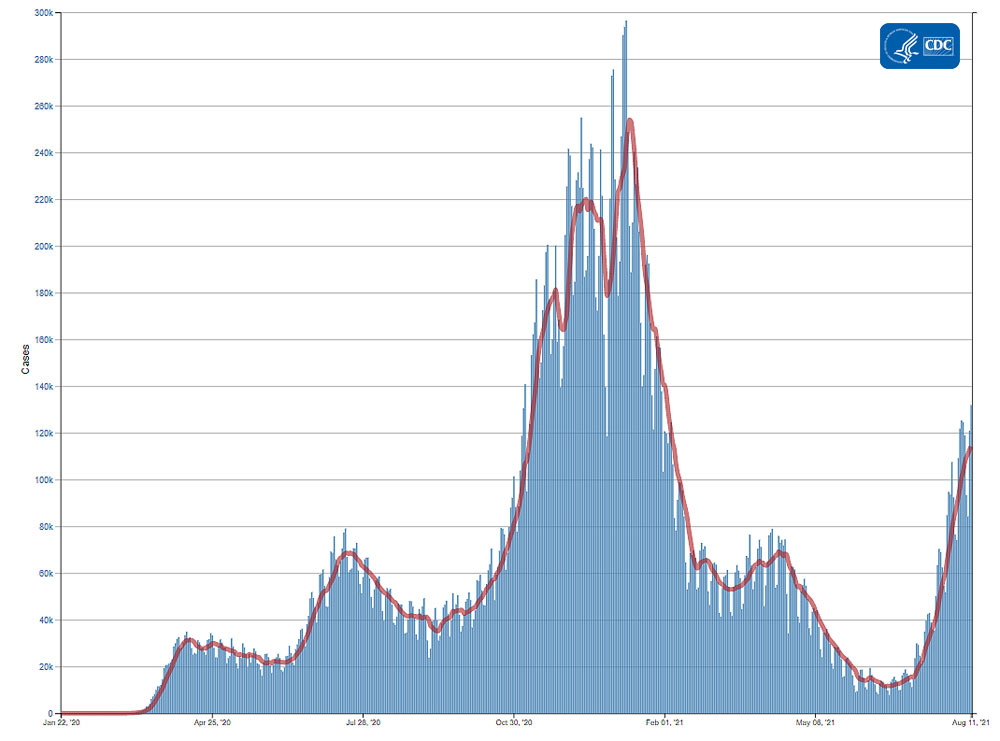
The current 7-day moving average of daily new cases (114,190) increased 18.4% compared with the previous 7-day moving average (96,454). The current 7-day moving average is 66.3% higher compared to the peak observed on July 20, 2020 (68,685). The current 7-day moving average is 65.0% lower than the peak observed on January 10, 2021 (254,023) and is 882.8% higher than the lowest value observed on June 19, 2021 (11,619). A total of 36,268,057 COVID-19 cases have been reported as of August 11.
36,268,057
Total Cases Reported
36,268,057
Total Cases Reported
114,190
Current 7-Day Average*
114,190
Current 7-Day Average*
96,454
Prior 7-Day Average
96,454
Prior 7-Day Average
+18.4%
Change in 7-Day Average since Prior Week
+18.4%
Change in 7-Day Average since Prior Week
*Historical cases are excluded from daily new cases and 7-day average calculations until they are incorporated into the dataset for the applicable date. Of 90,975 historical cases reported retroactively, 10,385 were reported in the current week and 2,809 were reported in the prior week.
Daily Trends in COVID-19 Cases in the United States Reported to CDC

7-Day moving average
SARS-CoV-2 Variants
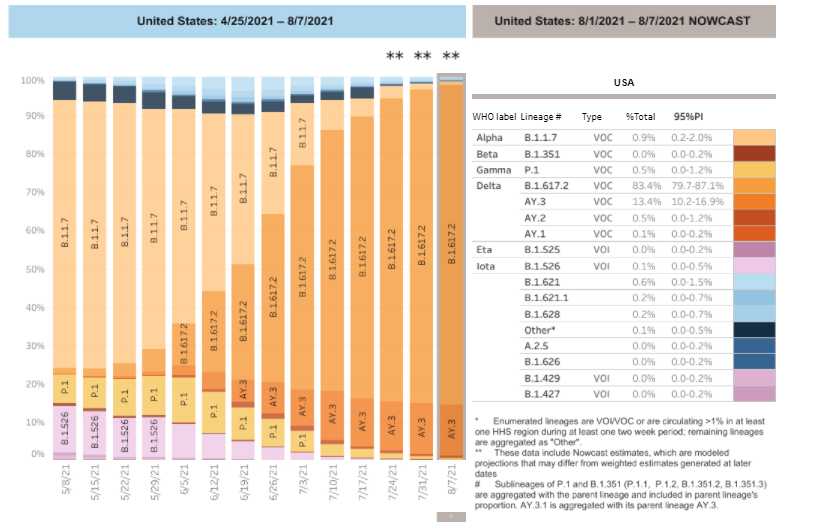
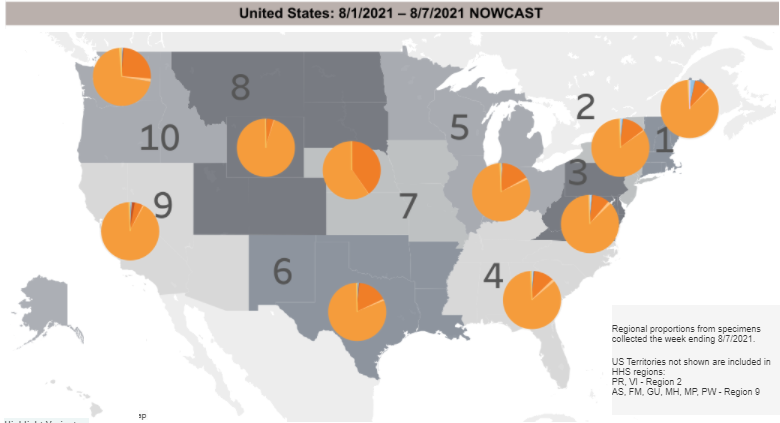
Multiple variants of the virus that causes COVID-19 are circulating globally, including within the United States. Currently, four variants are classified as a variant of concern (VOC). Nowcast estimates* of COVID-19 cases caused by these VOCs for the week ending August 7 are summarized here. Nationally, the combined proportion of cases attributed to Delta (B.1.617.2, AY.1, AY.2, AY.3) is estimated to increase to 97.4%; Alpha (B.1.1.7) proportion is estimated to decrease to 0.9%; Gamma (P.1) proportion is estimated to decrease to 0.5%; and Beta (B.1.351) is estimated to be less than 0.1%. Nowcast estimates that Delta (B.1.617.2, AY.1, AY.2, and AY.3) will continue to be the predominant variant circulating in all 10 HHS regions. Alpha (B.1.1.7) is estimated to be 1.6% or less in all HHS regions. Gamma (P.1) is estimated to be 1.2% or less in all HHS regions; and Beta (B.1.351) is estimated to be less than 0.1% in all HHS regions.
*The median time from specimen collection to sequence data reporting is about 3 weeks. As a result, weighted estimates for the most recent few weeks may be unstable or unavailable. CDC’s Nowcast is a data projection tool that helps fill this gap by generating timely estimates of variant proportions for variants that are circulating in the United States. View Nowcast estimates on CDC’s COVID Data Tracker website on the Variant Proportions page.
Testing
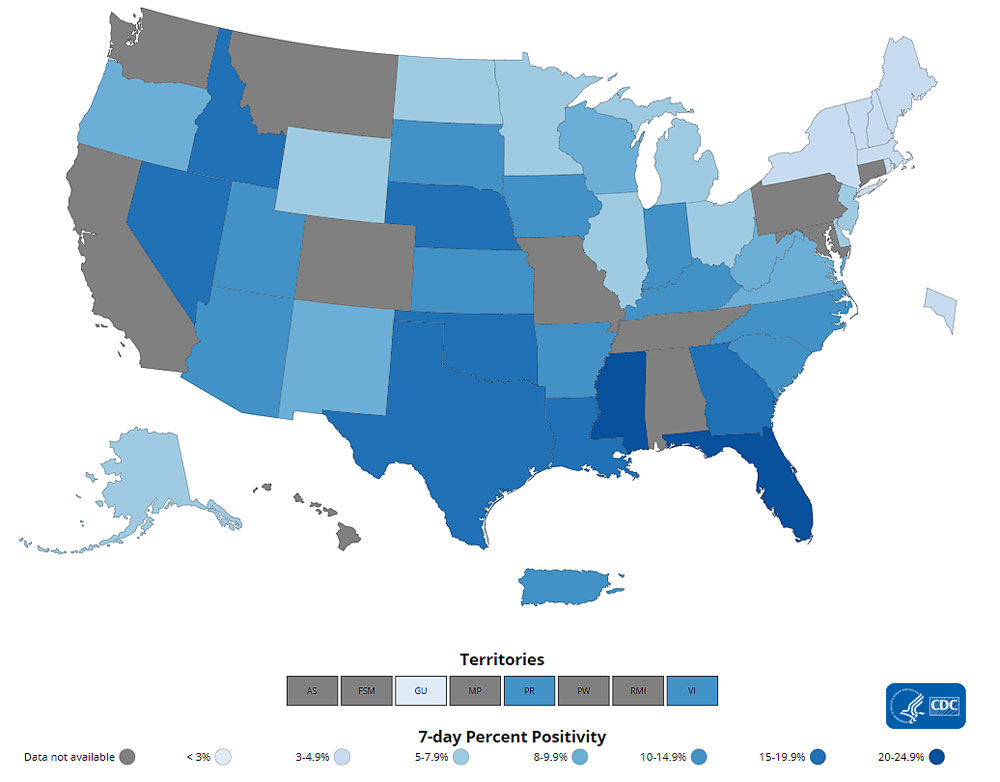
The percentage of COVID-19 NAATs (nucleic acid amplification tests)* that are positive (percent positivity) has decreased from the previous week. The 7-day average of percent positivity from tests is now 9.7%. The 7-day average number of tests reported for Jul 30 – Aug 05 was 957,470, up 13.0% from 847,621 for the prior 7 days.
499,711,732
Total Tests Reported
499,711,732
Total Tests Reported
957,470
7-Day Average Tests Reported
957,470
7-Day Average Tests Reported
9.7%
7-Day Average % Positivity
9.7%
7-Day Average % Positivity
10.0%
Previous 7-Day Average % Positivity
10.0%
Previous 7-Day Average % Positivity
-3.2%
Change in 7-Day Average % Positivity since Prior Week
-3.2%
Change in 7-Day Average % Positivity since Prior Week
*Test for SARS-CoV-2, the virus that causes COVID-19
COVID-19 NAAT Laboratory Test 7-day Percent Positivity by State/Territory
Vaccinations
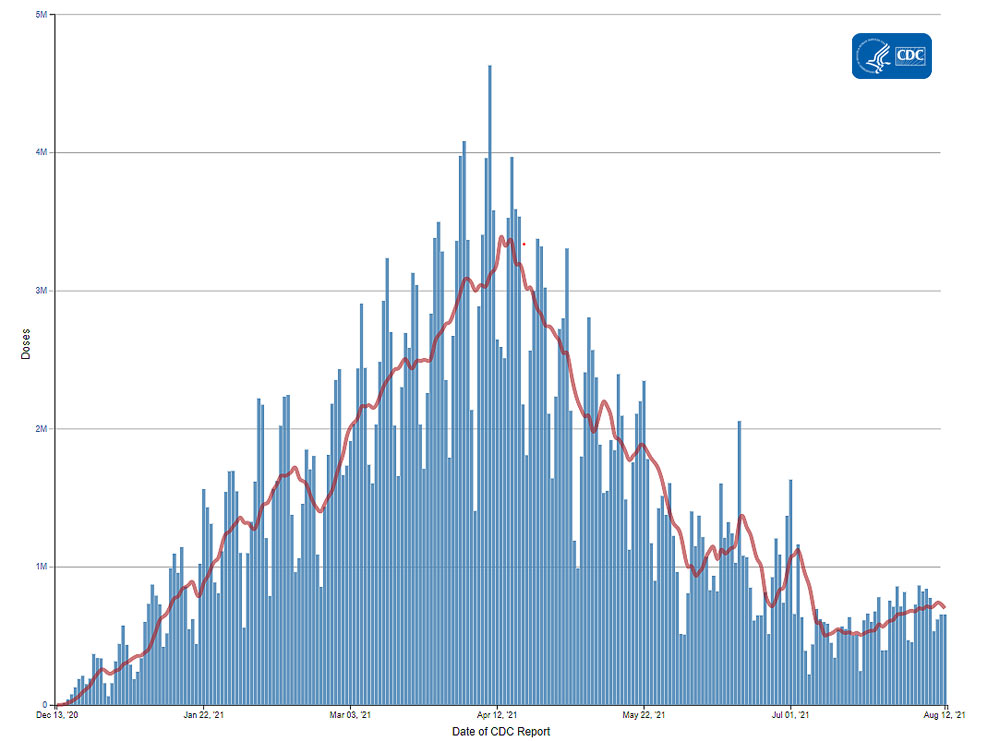
The U.S. COVID-19 Vaccination Program began December 14, 2020. As of August 12, 353.9 million vaccine doses have been administered. Overall, about 196.5 million people, or 59.2% of the total U.S. population, have received at least one dose of vaccine. About 167.4 million people, or 50.4% of the total U.S. population, have been fully vaccinated.* As of August 12, the 7-day average number of administered vaccine doses reported (by date of CDC report) to CDC per day was 699,068, a 0.03% decrease from the previous week.
CDC’s COVID Data Tracker Vaccination Demographic Trends tab shows vaccination trends by age group. As of August 12, 90.6% of people ages 65 or older have received at least one dose of vaccine and 80.6% are fully vaccinated. Over two-thirds (71.5%) of people ages 18 or older have received at least one dose of vaccine and 61.3% are fully vaccinated. For people ages 12 or older, 69.2% have received at least one dose of vaccine and 59% are fully vaccinated.
353,859,894
Vaccines Administered
353,859,894
Vaccines Administered
196,505,543
People who received at least one dose
196,505,543
People who received at least one dose
167,354,729
People who are fully vaccinated*
167,354,729
People who are fully vaccinated*
59.2%
Percentage of the US population that has received at least one dose
59.2%
Percentage of the US population that has received at least one dose
50.4%
Percentage of the US population that has been fully vaccinated*
50.4%
Percentage of the US population that has been fully vaccinated*
+1.0%
Percentage point increase from last week
+1.0%
Percentage point increase from last week
+0.5%
Percentage point increase from last week
+0.5%
Percentage point increase from last week
*People are considered fully vaccinated 2 weeks after their second dose in a 2-dose series (such as the Pfizer or Moderna vaccines), or 2 weeks after a single-dose vaccine (such as Johnson & Johnson’s Janssen vaccine).
Daily Change in the Total Number of Administered Doses Reported to CDC by the date of CDC Report, United States

7-Day moving average
Hospitalizations
New Hospital Admissions
The current 7-day average for August 4–August 10 was 10,072. This is a 29.6% increase from the prior 7-day average (7,771) from July 28–August 3. The 7-day moving average for new admissions has consistently increased since June 25, 2021. New admissions of patients with confirmed COVID-19 are currently at their highest levels since the start of the pandemic in Florida, Louisiana, and Oregon.
2,507,105
Total New Admissions
2,507,105
Total New Admissions
10,072
Current 7-Day Average
10,072
Current 7-Day Average
7,771
Prior 7-Day Average
7,771
Prior 7-Day Average
+29.6%
Change in 7-Day Average
+29.6%
Change in 7-Day Average
The start of consistent reporting of hospital admissions data was August 1, 2020.
Daily Trends in Number of New COVID-19 Hospital Admissions in the United States
New admissions are pulled from a 10 am EST snapshot of the HHS Unified Hospital Timeseries Dataset. Due to potential reporting delays, data from the most recent 7 days, as noted in the figure above with the grey bar, should be interpreted with caution. Small shifts in historic data may also occur due to changes in the CMS Provider of Services file, which is used to identify the cohort of included hospitals.
COVID-NET: Trends in Hospitalizations in Children Ages 5–17 Years
CDC’s Coronavirus Disease 2019-Associated Hospitalization Surveillance Network (COVID-NET) shows that hospitalization rates are increasing, including rates in school-aged children ages 5 to 17 years. While rates are higher in adults, children are also at risk for COVID-19-associated hospitalizations. Rates in both children ages 5 to 11 and 12 to 17 years increased over the past several weeks. Weekly rates in children ages 5 to 11 years, who are not eligible for available COVID-19 vaccines, increased from 0.2 per 100,000 population for the week ending June 19, 2021, to 0.4 per 100,000 for the week ending July 24, 2021. Rates in children 12–17 years, who are eligible for vaccination, have also increased in recent weeks.
Trends in Rates of COVID-19-Associated Hospitalizations in Children Ages 5–11 and 12–17 Years
The Coronavirus Disease 2019 (COVID-19)-Associated Hospitalization Surveillance Network (COVID-NET) is an additional source for hospitalization data collected through a network of more than 250 acute-care hospitals in 14 states (representing ~10% of the U.S. population). Detailed data on patient demographics, including race/ethnicity, underlying medical conditions, medical interventions, and clinical outcomes, are standardized case reporting form.
Deaths
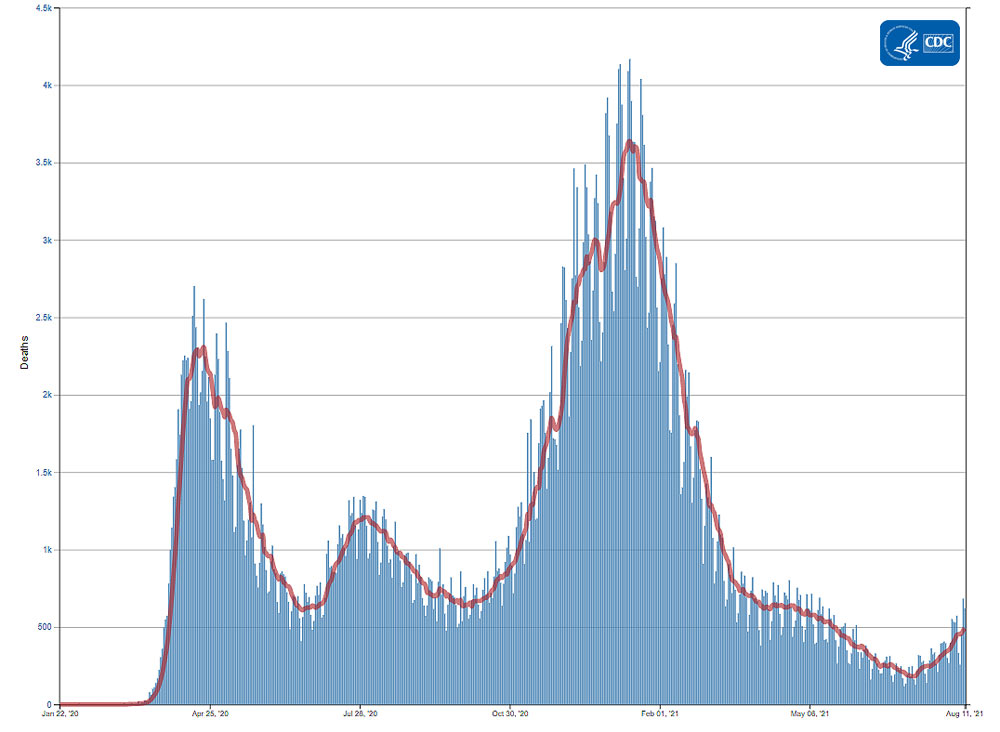
The current 7-day moving average of new deaths (492) has increased 21.0% compared with the previous 7-day moving average (407). The current 7-day moving average is 59.3% lower compared to the peak observed on August 2, 2020 (1,210). The current 7-day moving average is 86.5% lower than the peak observed on January 13, 2021 (3,640) and is 170.4% higher than the lowest value observed on July 10, 2021 (182). As of August 11, a total of 617,096 COVID-19 deaths have been reported in the United States.
617,096
Total Deaths Reported
617,096
Total Deaths Reported
492
Current 7-Day Average*
492
Current 7-Day Average*
407
Prior 7-Day Average
407
Prior 7-Day Average
+21.0%
Change in 7-Day Average Since Prior Week
+21.0%
Change in 7-Day Average Since Prior Week
*Historical deaths are excluded from the daily new deaths and 7-day average calculations until they are incorporated into the dataset by their applicable date. Of 6,338 historical deaths reported retroactively, 44 were reported in the current week and 147 were reported in the prior week.
Daily Trends in Number of COVID-19 Deaths in the United States Reported to CDC

7-Day moving average
- Hospitalization Rates and Characteristics of Children Aged <18 Years Hospitalized with Laboratory-Confirmed COVID-19 — COVID-NET, 14 States, March 1–July 25, 2020
- Emergency Department Visits for Suspected Suicide Attempts Among Persons Aged 12–25 Years Before and During the COVID-19 Pandemic — United States, January 2019–May 2021 | MMWR (cdc.gov)
- Mental Health, Substance Use, and Suicidal Ideation During the COVID-19 Pandemic — United States, June 24–30, 2020 | MMWR (cdc.gov)
- Mental Health–Related Emergency Department Visits Among Children Aged 18 Years During the COVID-19 Pandemic — United States, January 1–October 17, 2020 | MMWR (cdc.gov)
- Use of COVID-19 Vaccines After Reports of Adverse Events Among Adult Recipients of Janssen (Johnson & Johnson) and mRNA COVID-19 Vaccines (Pfizer-BioNTech and Moderna): Update from the Advisory Committee on Immunization Practices — United States, July 2021
- Effectiveness of COVID-19 Vaccines in Preventing Hospitalization Among Adults Aged ≥65 Years — 13 states, COVID-NET, February–April 2021
- Reduced Risk of Reinfection with SARS-CoV-2 After COVID-19 Vaccination — Kentucky, May–June 2021
- Rapid Increase in Circulation of the SARS-CoV-2 B.1.617.2 (Delta) Variant — Mesa County, Colorado, April–June 2021
- Alternative Methods for Grouping Race and Ethnicity to Monitor COVID-19 Outcomes and Vaccination Coverage
Recent COVID Data Tracker Updates
- New Multisystem Inflammatory Syndrome in Children (MIS-C) tab shows the number of MIS-C cases in the United States by state, time, and demographic categories
- New bivariate map on the Vaccination and Other Outcomes tab displays vaccination rate by testing positivity percent
- Vaccination trend lines are now available at the state level on the Daily and Total Trends tab
