Recommendations for Fully Vaccinated People
COVID-19 Homepage

Baby on Board
Interpretive Summary for August 20, 2021
Baby on Board
As of August 19, 2021, nearly 200 million people in the United States have received at least one dose of a COVID-19 vaccine. However, vaccination among pregnant people remains low. Data show that only about 1 in every 4 pregnant people report vaccination, and certain groups have much lower uptake.*1 This low uptake persists despite recent increases in COVID-19 cases in pregnant people. CDC recommends all people 12 years and older – including people who are pregnant, breastfeeding, trying to get pregnant now, or who might become pregnant in the future – get vaccinated against COVID-19.
Compared to non-pregnant people, pregnant and recently pregnant people are at increased risk for severe illness from COVID-19, including illness that requires hospitalization, intensive care, a ventilator or special equipment to breathe, or illness that results in death.2-5 Having certain underlying medical conditions and other factors, including age, can further increase a pregnant person’s risk for developing severe COVID-19.4 Additionally, changes that occur in the body during pregnancy that increase the risk for severe illness can continue after pregnancy. Pregnant people with COVID-19 are also at increased risk for preterm birth and might be at increased risk for other poor pregnancy outcomes.3
Vaccines provide the best protection against COVID-19. It is important for pregnant people and those who live with or visit them to take steps to protect themselves. New CDC data provide further evidence that COVID-19 vaccines are safe for people who are pregnant, including those early in pregnancy. Additionally, there is currently no evidence that any vaccines, including COVID-19 vaccines, cause fertility problems in women or men. Many people have become pregnant after receiving a COVID-19 vaccine, including some who got vaccinated during COVID-19 vaccine clinical trials.6–8 If you have questions about getting vaccinated, talking with your healthcare professional may help, but is not required before vaccination. To find a vaccine provider near you, visit Vaccines.gov or your state or local public health department website.
*A recent CDC study shows that, even though COVID-19 vaccination coverage among pregnant people has been increasing, Black and Hispanic women have the lowest vaccination coverage among all racial and ethnic groups. Similar results have been reported with other vaccinations during pregnancy. These findings highlight racial and ethnic disparities in COVID-19 vaccination coverage among pregnant people, indicating a need to prioritize vaccine equity for racial and ethnic minority groups by addressing potential barriers and access issues. To learn more about what CDC is doing to address health equity, visit Health Equity in Action.
Note to readers: If you or someone you know is pregnant or thinking about becoming pregnant, CDC has several COVID-19 and pregnancy resources available.
- For information on COVID-19 vaccines and pregnancy, visit Pregnant and Recently Pregnant People and COVID-19 Vaccines for People who Would Like to Have a Baby.
- For information on caring for newborns when the parent has COVID-19, breastfeeding and COVID-19, and keeping your baby safe and healthy, visit Breastfeeding and Caring for Newborns.
- For information on what CDC is doing to support efforts to increase our understanding of the impact of COVID-19 on pregnant people and infants, visit Investigating the Impact of COVID-19 during Pregnancy.
- For data on severity of maternal illness, visit COVID Data Tracker.
- For data on birth and infant outcomes, visit COVID Data Tracker.
Reported Cases
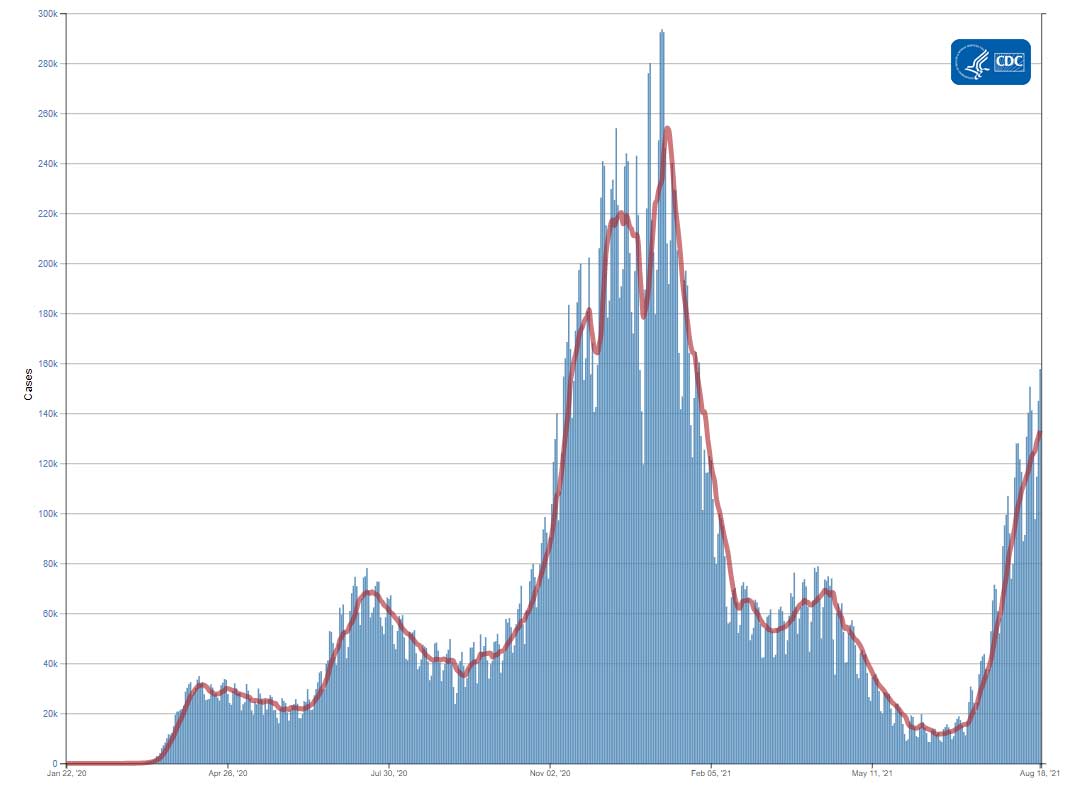
The current 7-day moving average of daily new cases (133,056) increased 14.0% compared with the previous 7-day moving average (116,740). The current 7-day moving average is 93.9% higher compared to the peak observed on July 20, 2020 (68,636). The current 7-day moving average is 47.6% lower than the peak observed on January 10, 2021 (254,108) and is 1042.0% higher than the lowest value observed on June 18, 2021 (11,651). A total of 37,259,886 COVID-19 cases have been reported as of August 18.
37,259,886
Total Cases Reported
37,259,886
Total Cases Reported
133,056
Current 7-Day Average*
133,056
Current 7-Day Average*
116,740
Prior 7-Day Average
116,740
Prior 7-Day Average
+14.0%
Change in 7-Day Average since Prior Week
+14.0%
Change in 7-Day Average since Prior Week
*Historical cases are excluded from daily new cases and 7-day average calculations until they are incorporated into the dataset for the applicable date. Of 94,471 historical cases reported retroactively, 3,546 were reported in the current week and 10,340 were reported in the prior week.
Daily Trends in COVID-19 Cases in the United States Reported to CDC

7-Day moving average
SARS-CoV-2 Variants
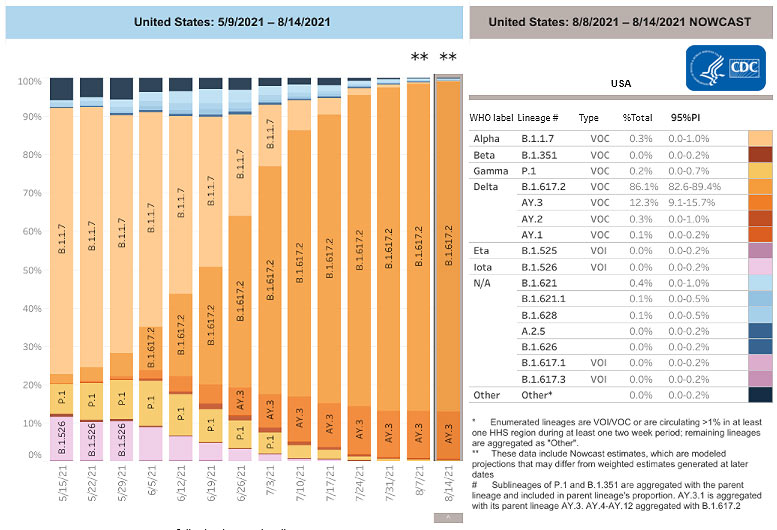
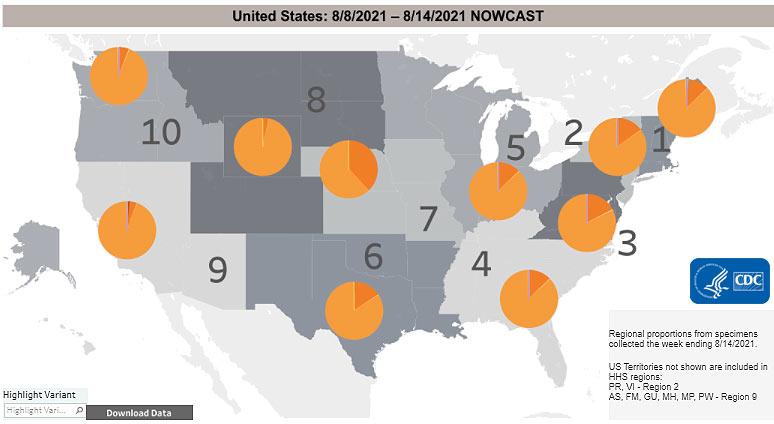
Multiple variants of the virus that causes COVID-19 are circulating globally, including within the United States. Currently, four variants are classified as a variant of concern (VOC). Nowcast estimates* of COVID-19 cases caused by these VOCs for the week ending August 14 are summarized here. Nationally, the combined proportion of cases attributed to Delta is estimated to increase to 98.8%; Alpha proportion is estimated to decrease to 0.3%; Gamma proportion is estimated to decrease to 0.2%; and Beta is estimated to be less than 0.1%. Nowcast estimates that Delta will continue to be the predominant variant circulating in all 10 U.S. Department of Health and Human Services (HHS) regions. Alpha is estimated to be 0.6% or less in all HHS regions. Gamma is estimated to be 0.5% or less in all HHS regions; and Beta is estimated to be less than 0.1% in all HHS regions.
*The median time from specimen collection to sequence data reporting is about 3 weeks. As a result, weighted estimates for the most recent few weeks may be unstable or unavailable. CDC’s Nowcast is a data projection tool that helps fill this gap by generating timely estimates of variant proportions for variants that are circulating in the United States. View Nowcast estimates on CDC’s COVID Data Tracker website on the Variant Proportions page.
Testing
The percentage of COVID-19 NAATs (nucleic acid amplification tests)* that are positive (percent positivity) has decreased from the previous week. The 7-day average of percent positivity from tests is now 9.7%. The 7-day average number of tests reported for August 06 – August 12 was 1,067,160, up 9.1% from 978,584 for the prior 7 days.
507,583,701
Total Tests Reported
507,583,701
Total Tests Reported
1,067,160
7-Day Average Tests Reported
1,067,160
7-Day Average Tests Reported
9.7%
7-Day Average % Positivity
9.7%
7-Day Average % Positivity
9.8%
Previous 7-Day Average % Positivity
9.8%
Previous 7-Day Average % Positivity
-1.4%
Change in 7-Day Average % Positivity since Prior Week
-1.4%
Change in 7-Day Average % Positivity since Prior Week
*Test for SARS-CoV-2, the virus that causes COVID-19
COVID-19 NAAT Laboratory Test 7-day Percent Positivity by State/Territory
Vaccinations
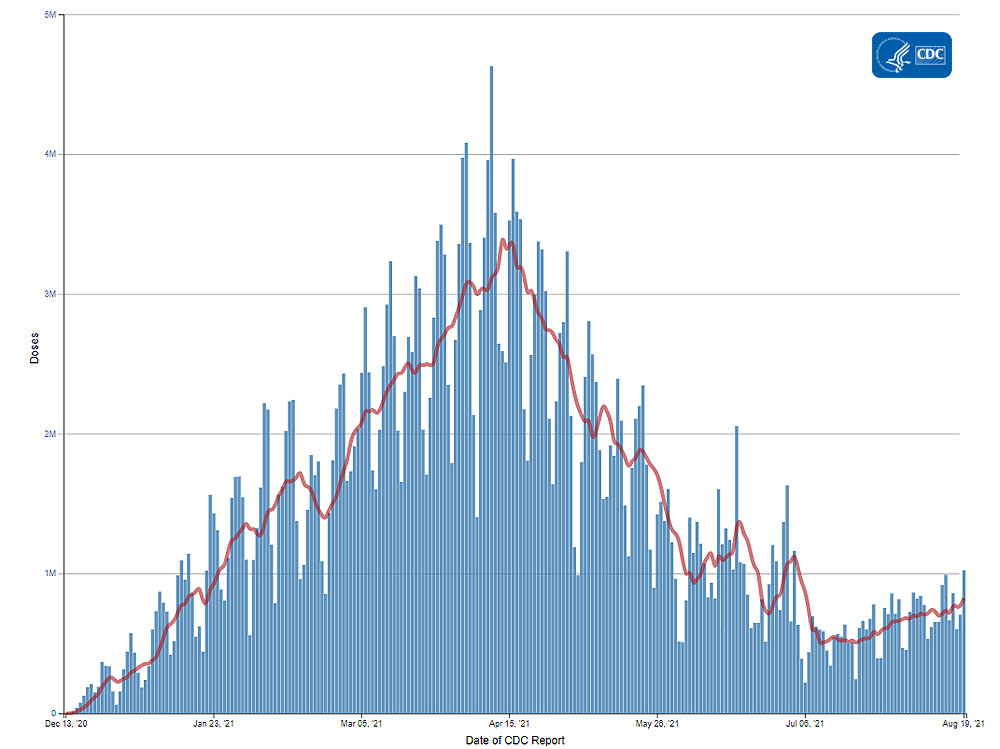
The U.S. COVID-19 Vaccination Program began December 14, 2020. As of August 19, 359.6 million vaccine doses have been administered. Overall, about 199.9 million people, or 60.2% of the total U.S. population, have received at least one dose of vaccine. About 169.6 million people, or 51.1% of the total U.S. population, have been fully vaccinated.* As of August 19, the 7-day average number of administered vaccine doses reported (by date of CDC report) to CDC per day was 823,355, a 17.78% increase from the previous week.
CDC’s COVID Data Tracker Vaccination Demographic Trends tab shows vaccination trends by age group. As of August 19, 91.1% of people ages 65 years or older have received at least one dose of vaccine and 81% are fully vaccinated. Over two-thirds (72.5%) of people ages 18 years or older have received at least one dose of vaccine and 62% are fully vaccinated. For people ages 12 years or older, 70.4% have received at least one dose of vaccine and 59.8% are fully vaccinated.
359,623,380
Vaccines Administered
359,623,380
Vaccines Administered
199,887,548
People who received at least one dose
199,887,548
People who received at least one dose
169,592,873
People who are fully vaccinated*
169,592,873
People who are fully vaccinated*
60.2%
Percentage of the US population that has received at least one dose
60.2%
Percentage of the US population that has received at least one dose
51.1%
Percentage of the US population that has been fully vaccinated*
51.1%
Percentage of the US population that has been fully vaccinated*
+1.0%
Percentage point increase from last week
+1.0%
Percentage point increase from last week
+0.7%
Percentage point increase from last week
+0.7%
Percentage point increase from last week
*Represents the number of people who have received the second dose in a two-dose COVID-19 vaccine series (such as the Pfizer or Moderna vaccines),) or one dose of the single-shot Johnson & Johnson’s Janssen vaccine.
Daily Change in the Total Number of Administered Doses Reported to CDC by the date of CDC Report, United States

7-Day moving average
Hospitalizations
New Hospital Admissions
The current 7-day average for August 11–August 17 was 11,521. This is a 14.2% increase from the prior 7-day average (10,088) from August 4–August 10. New admissions of patients with confirmed COVID-19 are currently at their highest levels since the start of the pandemic in Alabama, Florida, Louisiana, Mississippi, Oregon, and Washington.
2,587,871
Total New Admissions
2,587,871
Total New Admissions
11,521
Current 7-Day Average
11,521
Current 7-Day Average
10,088
Prior 7-Day Average
10,088
Prior 7-Day Average
+14.2%
Change in 7-Day Average
+14.2%
Change in 7-Day Average
The start of consistent reporting of hospital admissions data was August 1, 2020.
Daily Trends in Number of New COVID-19 Hospital Admissions in the United States
New admissions are pulled from a 10 am EST snapshot of the HHS Unified Hospital Timeseries Dataset. Due to potential reporting delays, data from the most recent 7 days, as noted in the figure above with the grey bar, should be interpreted with caution. Small shifts in historic data may also occur due to changes in the Centers for Medicare and Medicaid Services (CMS) Provider of Services file, which is used to identify the cohort of included hospitals.
COVID-NET: Trends in Hospitalizations in Non-Hispanic Black People
CDC’s Coronavirus Disease 2019-Associated Hospitalization Surveillance Network (COVID-NET) shows that since the start of the pandemic, people from racial and ethnic minority groups have been at increased risk for COVID-19-associated hospitalizations compared to non-Hispanic White people. While rates of hospitalizations have started to increase in all race and ethnicity groups since June 2021, the hospitalization rate for non-Hispanic Black people increased faster and has risen higher than other groups. For the week ending July 31, 2021, preliminary data show rates of COVID-19-associated hospitalizations in non-Hispanic Black people were 11.5 per 100,000 population—more than twice as high as rates in non-Hispanic White people (4.2 per 100.000). For the week ending July 31, 2021, the rate of COVID-19-associated hospitalizations in non-Hispanic Black people are the highest of any race and ethnicity group.
Trends in Rates of COVID-19-Associated Hospitalizations in Non-Hispanic Black People
The Coronavirus Disease 2019 (COVID-19)-Associated Hospitalization Surveillance Network (COVID-NET) is an additional source for hospitalization data collected through a network of more than 250 acute-care hospitals in 14 states (representing ~10% of the U.S. population). Detailed data on patient demographics, including race/ethnicity, underlying medical conditions, medical interventions, and clinical outcomes, are standardized case reporting form.
Deaths
The current 7-day moving average of new deaths (641) has increased 10.8% compared with the previous 7-day moving average (578). The current 7-day moving average is 47.1% lower compared to the peak observed on July 30, 2020 (1,211). The current 7-day moving average is 82.4% lower than the peak observed on January 13, 2021 (3,644) and is 237.4% higher than the lowest value observed on July 10, 2021 (190). As of August 18, a total of 623,244 COVID-19 deaths have been reported in the United States.
623,244
Total Deaths Reported
623,244
Total Deaths Reported
641
Current 7-Day Average*
641
Current 7-Day Average*
578
Prior 7-Day Average
578
Prior 7-Day Average
+10.8%
Change in 7-Day Average Since Prior Week
+10.8%
Change in 7-Day Average Since Prior Week
*Historical deaths are excluded from the daily new deaths and 7-day average calculations until they are incorporated into the dataset by their applicable date. Of 6,287 historical deaths reported retroactively, 37 were reported in the current week and 13 were reported in the prior week.
Daily Trends in Number of COVID-19 Deaths in the United States Reported to CDC

7-Day moving average
- CDC. COVID Data Tracker: Percent of Pregnant People aged 18-49 years receiving at least one dose of a COVID-19 vaccine during pregnancy overall, by race/ethnicity, and date reported to CDC – Vaccine Safety Datalink*, United States. Atlanta, GA: US Department of Health and Human Services, CDC; 2021.https://covid.cdc.gov/covid-data-tracker/#vaccinations-pregnant-women
- Zambrano LD, Ellington S, Strid P, et al. Update: Characteristics of Symptomatic Women of Reproductive Age with Laboratory-Confirmed SARS-CoV-2 Infection by Pregnancy Status — United States, January 22–October 3, 2020. MMWR Morb Mortal Wkly Rep 2020;69:1641–1647. DOI: 10.15585/mmwr.mm6944e3.
- Allotey, J., et al., Clinical manifestations, risk factors, and maternal and perinatal outcomes of coronavirus disease 2019 in pregnancy: living systematic review and meta-analysis. BMJ, 2020. 370: p. m3320. doi: 10.1136/bmj.m3320
- Galang RR, Newton SM, Woodworth KR, et al. Risk factors for illness severity among pregnant women with confirmed SARS-CoV-2 infection – Surveillance for Emerging Threats to Mothers and Babies Network, 22 state, local, and territorial health departments, March 29, 2020 -January 8, 2021. Clinical Infectious Diseases, 2021; ciab432. doi:1093/cid/ciab432
- Ko JY, DeSisto CL, Simeone RM, et al. Adverse pregnancy outcomes, maternal complications, and severe illness among U.S. delivery hospitalizations with and without a COVID-19 diagnosis [published online ahead of print, 2021 May 12]. Clin Infect Dis. 2021;ciab344. doi:10.1093/cid/ciab344
- Vaccines and Related Biological Products Advisory Committee Meeting. FDA Briefing Document. Janssen Ad26.COV2.S Vaccine for the Prevention of COVID-19. February 26, 2021. Available at: https://www.fda.gov/media/146217/download. Accessed August 18, 2021.
- Vaccines and Related Biological Products Advisory Committee Meeting. FDA Briefing Document. Pfizer-BioNTech COVID-19 Vaccine. December 10, 2020. Available at: https://www.fda.gov/media/144245/download. Accessed August 18, 2021.
- Vaccines and Related Biological Products Advisory Committee Meeting. FDA Briefing Document. Moderna COVID-19 Vaccine. December 17, 2020. Available at: Vaccines and Related Biological Products Advisory Committee December 17, 2020 Meeting Briefing Document – FDA. Accessed August 18, 2021.
- Effectiveness of Pfizer-BioNTech and Moderna Vaccines in Preventing SARS-CoV-2 Infection Among Nursing Home Residents Before and During Widespread Circulation of the SARS-CoV-2 B.1.617.2 (Delta) Variant — National Healthcare Safety Network, March 1–August 1, 2021
- New COVID-19 Cases and Hospitalizations Among Adults, by Vaccination Status — New York, May 3–July 25, 2021
- Sustained Effectiveness of Pfizer-BioNTech and Moderna Vaccines Against COVID-19 Associated Hospitalizations Among Adults — United States, March–July 2021
- Use of Rapid Antigen Testing for SARS-CoV-2 in Remote Communities — Yukon-Kuskokwim Delta, Alaska, September 15, 2020–March 1, 2021
- Disparities in Excess Mortality Associated with COVID-19 — United States, 2020
Recent COVID Data Tracker Updates
- Hospitalization data were added to the Daily and Total Trends tab to provide comparisons with key COVID-19 metrics
- County progress summary tables were added below each US-level map on the County View tab
- Summary tables were added to the Vaccination Equity tab to provide a count of counties that fall into each Vaccination Coverage/Social Vulnerability Index category


