Recommendations for Fully Vaccinated People
COVID-19 Homepage

An Ounce of Prevention
Interpretive Summary for September 10, 2021
An Ounce of Prevention
The United States recently surpassed 40 million COVID-19 cases since the start of the pandemic, with more than 4 million of these cases reported in the past few weeks. COVID-19 cases, hospitalizations, and deaths have generally increased throughout most of the country since the beginning of summer, fueled by the spread of the highly contagious Delta variant. Low vaccination coverage in many communities is driving these increases.
Although most people with COVID-19 get better within the weeks following illness, some people experience post-COVID conditions. A recent CDC study shows that adults who had COVID-19 may experience ongoing health problems that can last four or more weeks after COVID-19 infection. Health problems may include shortness of breath, fatigue, difficulty concentrating (“brain-fog”), headache, fast-beating or pounding heart, cough, joint or muscle pain, dizziness/lightheadedness, or mood changes, among other symptoms. Even people who did not have significant COVID-19 symptoms in the days or weeks after they were infected can have post-COVID conditions.
The best way to prevent post-COVID conditions is by getting vaccinated against COVID-19 as soon as you can. CDC recommends all people ages 12 years and older get vaccinated, including people who have had COVID-19 or a post-COVID condition. The COVID-19 vaccines recommended for use in the United States continue to offer protection against severe illness, hospitalization, and death. If you are not yet fully vaccinated, you can reduce the risk of long-term complications by taking steps to protect yourself and others from getting COVID-19. To find a vaccine provider near you, visit Vaccines.gov or your state or local public health department website.
Reported Cases
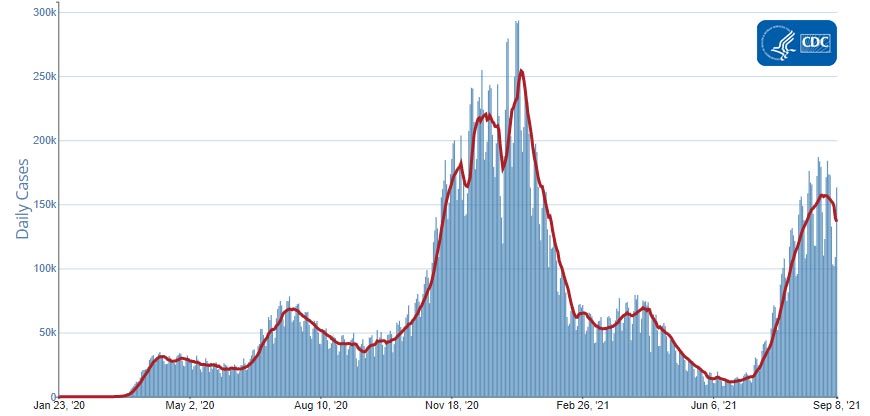
The current 7-day moving average of daily new cases (136,558) decreased 12.7% compared with the previous 7-day moving average (156,341). The current 7-day moving average is 99.3% higher than the value observed approximately one year ago (68,527 new cases on July 20, 2020). The current 7-day moving average is 46.2% lower than the peak observed on January 10, 2021 (254,016) and is 1,076.0% higher than the lowest value observed on June 18, 2021 (11,613). A total of 40,523,954 COVID-19 cases have been reported as of September 8, 2021.
40,523,954
Total Cases Reported
40,523,954
Total Cases Reported
136,558
Current 7-Day Average*
136,558
Current 7-Day Average*
156,341
Prior 7-Day Average
156,341
Prior 7-Day Average
-12.7%
Change in 7-Day Average since Prior Week
-12.7%
Change in 7-Day Average since Prior Week
*Historical cases are excluded from daily new cases and 7-day average calculations until they are incorporated into the dataset for the applicable date. Of 110,609 historical cases reported retroactively, 6,516 were reported in the current week and 4,575 were reported in the prior week.
Daily Trends in COVID-19 Cases in the United States Reported to CDC

7-Day moving average
SARS-CoV-2 Variants
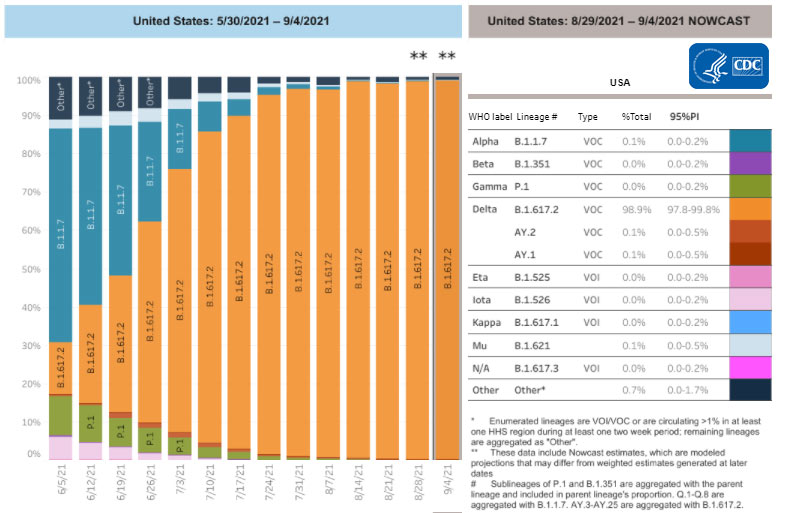
Multiple variants of the virus that causes COVID-19 are circulating globally, including within the United States. Currently, four variants are classified as a variant of concern (VOC). Nowcast estimates* of COVID-19 cases caused by these VOCs for the week ending September 4, 2021, are summarized here. Nationally, the combined proportion of cases attributed to Delta is estimated to be greater than 99%. The national proportions of Alpha, Beta, and Gamma are estimated to be well below 0.5%. Nowcast estimates indicate that Delta will continue to be the predominant variant circulating in all 10 U.S. Department of Health and Human Services (HHS) regions, circulating at greater than 99%. The proportions of Alpha, Beta, and Gamma are estimated to be well below 0.5% in all HHS regions.
On August 30, 2021, the Mu (B.1.621) variant of the virus that causes COVID-19 was classified as a Variant of Interest (VOI) by the World Health Organization (WHO). CDC has not escalated this variant to a VOI in the United States, where the Mu variant reached its peak in late June (<5% of circulating variants) and has steadily decreased since. CDC scientists continue to study and monitor all variants and will continue to provide information when variants change classification in the United States. Sign up here to stay informed on updates to the Variant Classification and Definitions webpage.
*The median time from specimen collection to sequence data reporting is about 3 weeks. As a result, weighted estimates for the most recent few weeks may be unstable or unavailable. CDC’s Nowcast is a data projection tool that helps fill this gap by generating timely estimates of variant proportions for variants that are circulating in the United States. View Nowcast estimates on CDC’s COVID Data Tracker website on the Variant Proportions page.
Testing
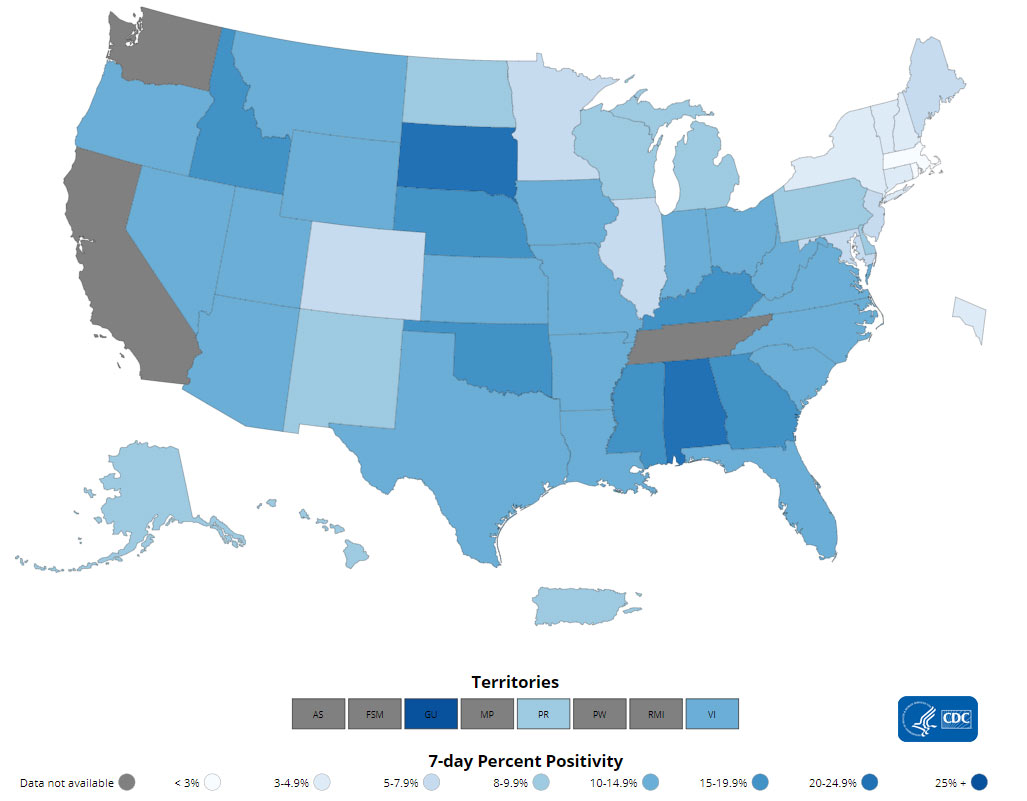
The percentage of COVID-19 NAATs (nucleic acid amplification tests)* that are positive (percent positivity) has decreased from the previous week. The 7-day average of percent positivity from NAATs is now 9.1%. The 7-day average number of tests reported for August 27-September 02, 2021, was 1,539,747, up 6.3% from 1,448,837 for the prior 7 days.
540,251,778
Total Tests Reported
540,251,778
Total Tests Reported
1,539,747
7-Day Average Tests Reported
1,539,747
7-Day Average Tests Reported
9.1%
7-Day Average % Positivity
9.1%
7-Day Average % Positivity
9.7%
Previous 7-Day Average % Positivity
9.7%
Previous 7-Day Average % Positivity
-5.5%
Change in 7-Day Average % Positivity since Prior Week
-5.5%
Change in 7-Day Average % Positivity since Prior Week
*Test for SARS-CoV-2, the virus that causes COVID-19
COVID-19 NAAT Laboratory Test 7-day Percent Positivity by State/Territory
Vaccinations
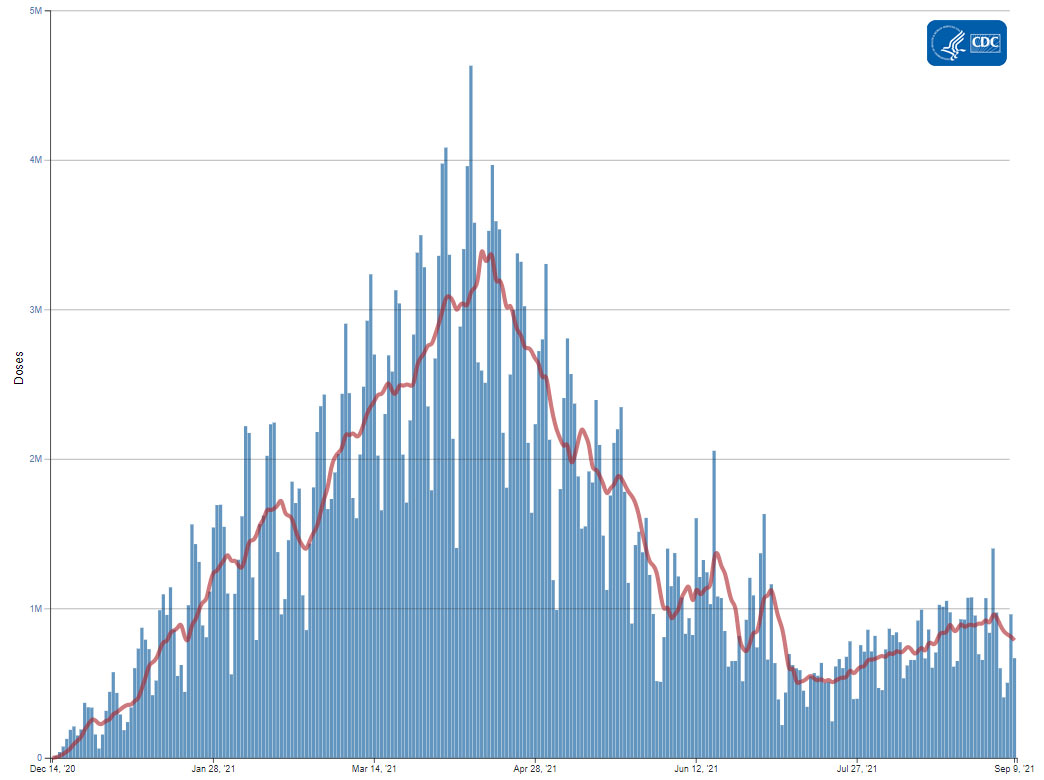
The U.S. COVID-19 Vaccination Program began December 14, 2020. As of September 9, 2021, 377.6 million vaccine doses have been administered. Overall, about 208.3 million people, or 62.7% of the total U.S. population, have received at least one dose of vaccine. About 177.4 million people, or 53.4% of the total U.S. population, have been fully vaccinated.* As of September 9, 2021, the 7-day average number of administered vaccine doses reported (by date of CDC report) to CDC per day was 786,493, a 13.3% decrease from the previous week.
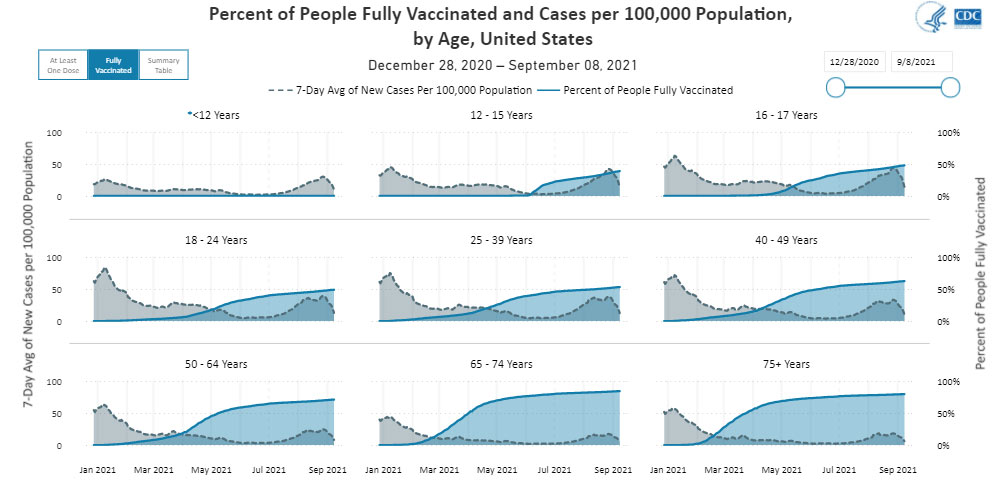
CDC’s COVID Data Tracker Vaccination Demographic Trends tab shows vaccination trends by age group. As of September 9, 2021, 92.6% of people ages 65 years or older have received at least one dose of vaccine and 82.2% are fully vaccinated. Over three-quarters (75.3%) of people ages 18 years or older have received at least one dose of vaccine and 64.5% are fully vaccinated. For people ages 12 years or older, 73.4% have received at least one dose of vaccine and 62.5% are fully vaccinated.
377,622,065
Vaccines Administered
377,622,065
Vaccines Administered
208,305,270
People who received at least one dose
208,305,270
People who received at least one dose
177,433,044
People who are fully vaccinated*
177,433,044
People who are fully vaccinated*
62.7%
Percentage of the US population that has received at least one dose
62.7%
Percentage of the US population that has received at least one dose
53.4%
Percentage of the US population that has been fully vaccinated*
53.4%
Percentage of the US population that has been fully vaccinated*
+0.7
Percentage point increase from last week
+0.7
Percentage point increase from last week
+0.7
Percentage point increase from last week
+0.7
Percentage point increase from last week
*Represents the number of people who have received the second dose in a two-dose COVID-19 vaccine series (such as the Pfizer or Moderna vaccines),) or one dose of the single-shot Johnson & Johnson’s Janssen vaccine.
Daily Change in the Total Number of Administered COVID-19 Vaccine Doses Reported to CDC by the Date of CDC Report, United States

7-Day moving average
Hospitalizations
New Hospital Admissions
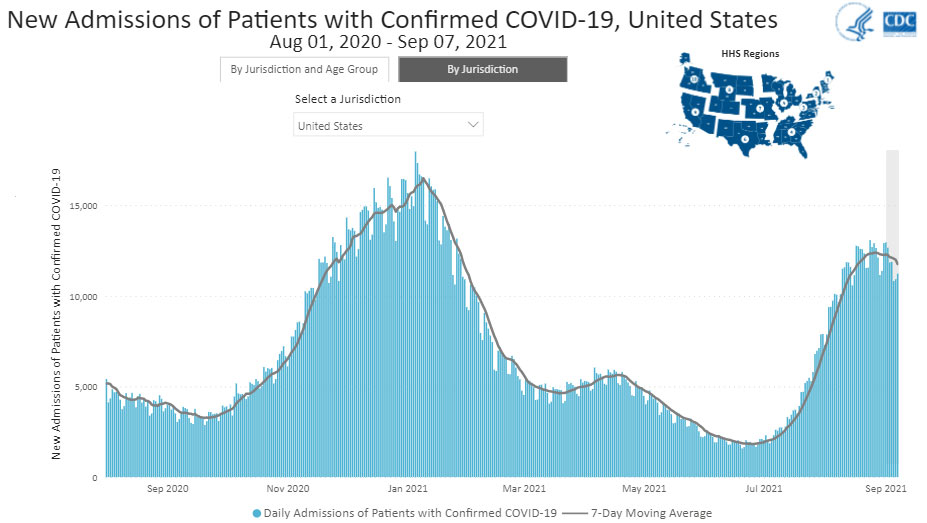
The current 7-day daily average for September 1–September7, 2021, was 11,754 This is a 4.1% decrease from the prior 7-day average (12,251) from August 25–August 31, 2021.
2,842,496
Total New Admissions
2,842,496
Total New Admissions
11,754
Current 7-Day Average
11,754
Current 7-Day Average
12,251
Prior 7-Day Average
12,251
Prior 7-Day Average
-4.1%
Change in 7-Day Average
-4.1%
Change in 7-Day Average
The start of consistent reporting of hospital admissions data was August 1, 2020.
Daily Trends in Number of New COVID-19 Hospital Admissions in the United States
New admissions are pulled from a 10 am EST snapshot of the HHS Unified Hospital Timeseries Dataset. Due to potential reporting delays, data from the most recent 7 days, as noted in the figure above with the grey bar, should be interpreted with caution. Small shifts in historic data may also occur due to changes in the Centers for Medicare and Medicaid Services (CMS) Provider of Services file, which is used to identify the cohort of included hospitals.
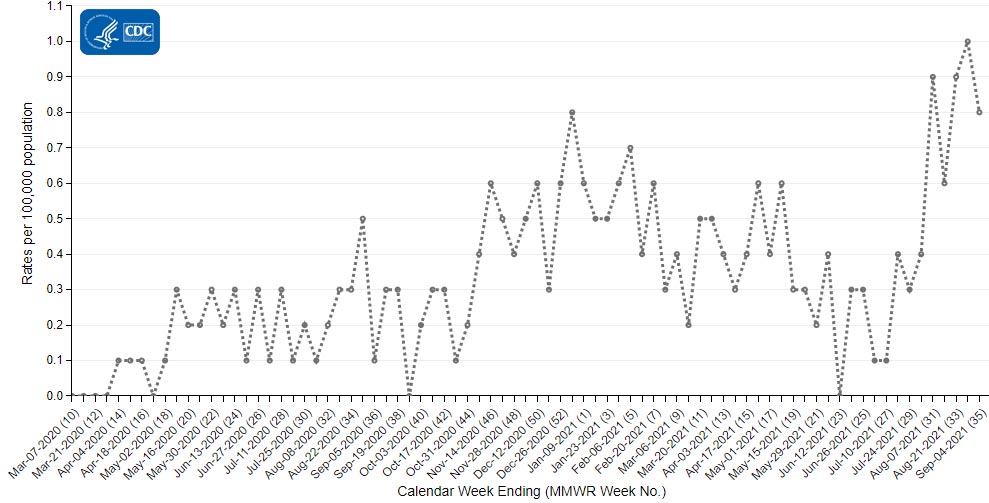
COVID-NET: Trends in Hospitalization Rates in Children and Adolescents Aged 5–11 Years
CDC’s Coronavirus Disease 2019-Associated Hospitalization Surveillance Network (COVID-NET) shows that rates of COVID-19-associated hospitalizations have risen rapidly for children and adolescents younger than 18 years old. Weekly rates of COVID-19-associated hospitalizations per 100,000 children ages 5 to 11 years have tripled over a recent 8-week period, from 0.3 per 100,000 children during the week ending June 26, 2021, to 0.9 per 100,000 children during the week ending August 21, 2021. These recent rates of COVID-19-associated hospitalization are the highest seen for this age group during the pandemic.
Additional information on COVID-19-associated hospitalizations in children and adolescents younger than 18 years old can be found in a new report using COVID-NET data here.
Trends in Hospitalization Rates in Children and Adolescents Aged 5–11 Years
The Coronavirus Disease 2019 (COVID-19)-Associated Hospitalization Surveillance Network (COVID-NET) is an additional source for hospitalization data collected through a network of more than 250 acute-care hospitals in 14 states (representing ~10% of the U.S. population). Detailed data on patient demographics, including race/ethnicity, underlying medical conditions, medical interventions, and clinical outcomes, are standardized case reporting form.
Deaths
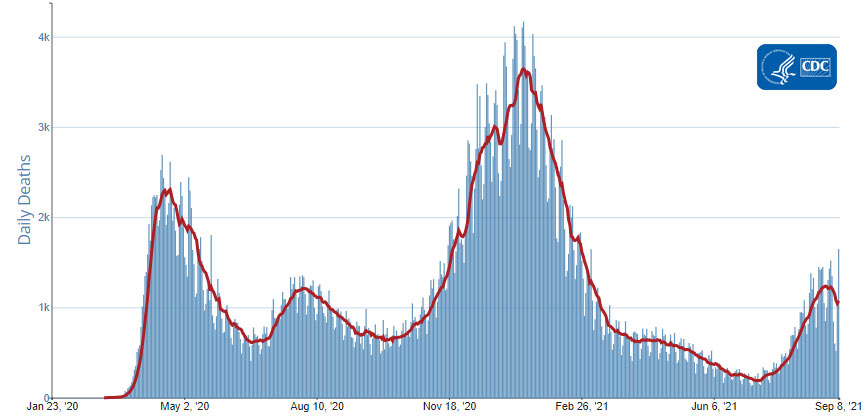
The current 7-day moving average of new deaths (1,077) has decreased 11.3% compared with the previous 7-day moving average (1,214). The current 7-day moving average is 11.1% lower compared to the peak observed on July 31, 2020 (1,211). The current 7-day moving average is 70.5% lower than the peak observed on January 13, 2021 (3,644) and is 463.4% higher than the lowest value observed on July 10, 2021 (191). As of September 8, 2021, a total of 652,480 COVID-19 deaths have been reported in the United States.
652,480
Total Deaths Reported
652,480
Total Deaths Reported
1,077
Current 7-Day Average*
1,077
Current 7-Day Average*
1,214
Prior 7-Day Average
1,214
Prior 7-Day Average
-11.3%
Change in 7-Day Average Since Prior Week
-11.3%
Change in 7-Day Average Since Prior Week
*Historical deaths are excluded from the daily new deaths and 7-day average calculations until they are incorporated into the dataset by their applicable date. Of 7,391 historical deaths reported retroactively, 229 were reported in the current week and 227 were reported in the prior week.
Daily Trends in Number of COVID-19 Deaths in the United States Reported to CDC

7-Day moving average
- Long-Term Symptoms Among Adults Tested for SARS-CoV-2 — United States, January 2020–April 2021
- Using Wastewater Surveillance Data to Support the COVID-19 Response — United States, 2020–2021
- SARS-CoV-2 Transmission to Masked and Unmasked Close Contacts of University Students with COVID-19 — St. Louis, Missouri, January–May 2021
- Trends in COVID-19 Cases, Emergency Department Visits, and Hospital Admissions Among Children and Adolescents Aged 0–17 Years — United States, August 2020–August 2021
- Hospitalizations Associated with COVID-19 Among Children and Adolescents — COVID-NET, 14 States, March 1, 2020–August 14, 2021
Recent COVID Data Tracker Updates
- A new Pediatric Data page catalogs all pediatric data available on COVID Data Tracker and provides cross-links to additional resources and recommendations
- Updated text and visualizations on the Vaccination among People with Disabilities tab
- Updated data and text on the Birth and Infant Outcomes tab
- Addition of the National Post-acute and Long-term Care Study (NPALS): Preliminary data from the Adult Day Services Centers (ADSC) and Residential Care Communities (RCC) components to the About Healthcare Data Page
