Recommendations for Fully Vaccinated People
COVID-19 Homepage

Vaccinations > Variants
Interpretive Summary for September 17, 2021
Vaccinations > Variants
SARS-CoV-2 Variants Circulating in the United States
After experiencing a brief decline in COVID-19 cases, the United States is once again seeing an increase in cases in most of the country. This recent increase follows a previous summer surge that was fueled by the highly contagious Delta (B.1.617.2) variant and low vaccination coverage in many communities. COVID-19 vaccines offer strong protection against serious illness and death. High vaccination coverage is proven to reduce the spread of the virus. The less a virus spreads, the less opportunity there is for new variants to emerge.
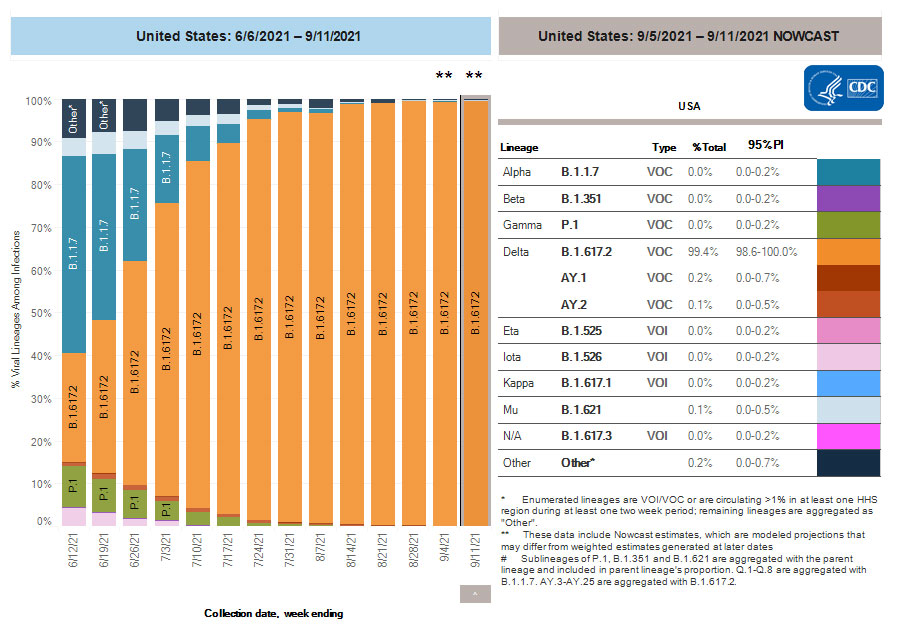
The virus that causes COVID-19 constantly changes, or mutates, producing new variants of the virus. The Delta variant continues to be the predominant strain in the United States, making up more than 99% of cases. On August 30, 2021, the World Health OrganizationExternal classified the Mu (B.1.621) variant as a Variant of Interest (VOI). CDC has not designated Mu as a VOI at this time. The Mu variant reached a peak in the United States in late June 2021 and has steadily declined since then.* CDC continues to study and monitor all known variants and will continue to provide information when variants change classification in the United States.
Getting vaccinated is the best way to protect yourself, your family, and your community. It is also the best way to prevent new variants from emerging. A recent CDC study found that people who were not fully vaccinated had about 10 times the risk of being hospitalized with or dying from COVID-19 compared with people who were fully vaccinated. CDC recommends that everyone in the United States 12 years and older get vaccinated as soon as possible. To find a vaccine provider near you, visit Vaccines.gov or your state or local public health department website.
*At its peak, Mu made up less than 5% of all variants circulating in the United States. Currently, Mu makes up less than 1% of all COVID-19 cases in the United States.
Note to readers: CDC scientists continue to study and monitor the Mu variant and will continue to provide information when variants change classification in the United States. Sign up here to stay informed on updates to the Variant Classification and Definitions webpage.
Reported Cases
The current 7-day moving average of daily new cases (146,182) increased 6.1% compared with the previous 7-day moving average (137,783). A total of 41,593,179 COVID-19 cases have been reported as of September 15, 2021.
41,593,179
Total Cases Reported
41,593,179
Total Cases Reported
146,182
Current 7-Day Average*
146,182
Current 7-Day Average*
137,783
Prior 7-Day Average
137,783
Prior 7-Day Average
6.1%
Change in 7-Day Average since Prior Week
6.1%
Change in 7-Day Average since Prior Week
*Historical cases are excluded from daily new cases and 7-day average calculations until they are incorporated into the dataset for the applicable date. Of 116,408 historical cases reported retroactively, 5,796 were reported in the current week and 6,516 were reported in the prior week.
Daily Trends in COVID-19 Cases in the United States Reported to CDC

7-Day moving average
SARS-CoV-2 Variants
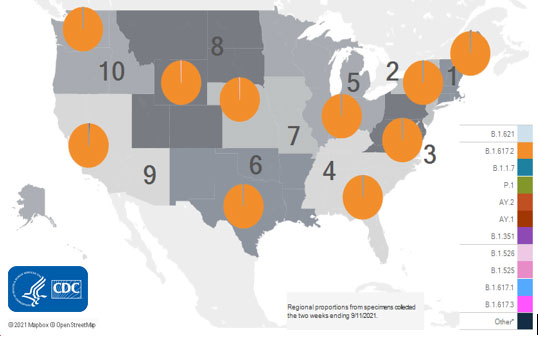
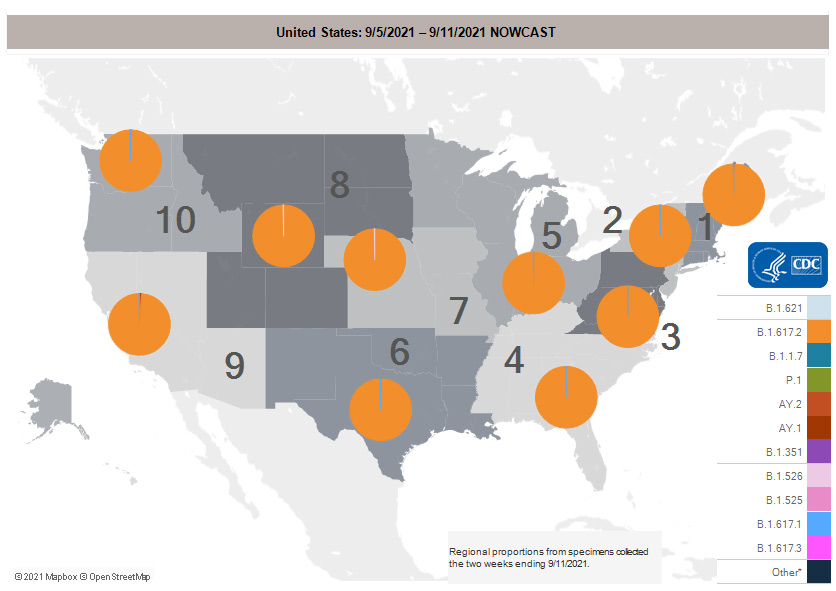
Multiple variants of the virus that causes COVID-19 are circulating globally, including within the United States. Currently, four variants are classified as a variant of concern (VOC). Nowcast estimates*of COVID-19 cases caused by these VOCs for the week ending September 11, 2021, are summarized here. Nationally, the combined proportion of cases attributed to Delta is estimated to be greater than 99%. The national proportions of Alpha, Beta, and Gamma are estimated to be less than 0.1%. Nowcast estimates indicate that Delta will continue to be the predominant variant circulating in all 10 U.S. Department of Health and Human Services (HHS) regions, circulating at greater than 99%. The proportions of Alpha, Beta, and Gamma are estimated to be less than or equal to 0.1% in all HHS regions.
*The median time from specimen collection to sequence data reporting is about 3 weeks. As a result, weighted estimates for the most recent few weeks may be unstable or unavailable. CDC’s Nowcast is a data projection tool that helps fill this gap by generating timely estimates of variant proportions for variants that are circulating in the United States. View Nowcast estimates on CDC’s COVID Data Tracker website on the Variant Proportions page.
Testing
The percentage of COVID-19 NAATs (nucleic acid amplification tests)* that are positive (percent positivity) has decreased from the previous week. The 7-day average of percent positivity from NAATs is now 8.9%. The 7-day average number of tests reported for September 3–September 9, 2021, was 1,394,082, down 14.1% from 1,623,346 for the prior 7 days.
551,805,555
Total Tests Reported
551,805,555
Total Tests Reported
1,394,082
7-Day Average Tests Reported
1,394,082
7-Day Average Tests Reported
8.9%
7-Day Averae % Positivity
8.9%
7-Day Averae % Positivity
9.1%
Previous 7-Day Average % Positivity
9.1%
Previous 7-Day Average % Positivity
-1.8%
Change in 7-Day Average % Positivity since Prior Week
-1.8%
Change in 7-Day Average % Positivity since Prior Week
*Test for SARS-CoV-2, the virus that causes COVID-19
COVID-19 NAAT Laboratory Test 7-day Percent Positivity by State/Territory
Vaccinations
The U.S. COVID-19 Vaccination Program began December 14, 2020. As of September 16, 2021, 383 million vaccine doses have been administered. Overall, about 210.7 million people, or 63.5% of the total U.S. population, have received at least one dose of vaccine. About 180.1 million people, or 54.2% of the total U.S. population, have been fully vaccinated.* As of September 16, 2021, the 7-day average number of administered vaccine doses reported (by date of CDC report) to CDC per day was 773,763, a 1.6% decrease from the previous week.
CDC’s COVID Data Tracker Vaccination Demographic Trends tab shows vaccination trends by age group. As of September 16, 2021, 93% of people ages 65 years or older have received at least one dose of vaccine and 82.7% are fully vaccinated. Over three-quarters (76.1%) of people ages 18 years or older have received at least one dose of vaccine and 65.4% are fully vaccinated. For people ages 12 years or older, 74.2% have received at least one dose of vaccine and 63.5% are fully vaccinated.
383,038,403
Vaccines Administered
383,038,403
Vaccines Administered
210,700,361
People who received at least one dose
210,700,361
People who received at least one dose
180,086,143
People who are fully vaccinated*
180,086,143
People who are fully vaccinated*
63.5%
Percentage of the US population that has received at least one dose
63.5%
Percentage of the US population that has received at least one dose
54.2%
Percentage of the US population that has been fully vaccinated*
54.2%
Percentage of the US population that has been fully vaccinated*
+0.8
Percentage point increase from last week
+0.8
Percentage point increase from last week
+0.8
Percentage point increase from last week
+0.8
Percentage point increase from last week
*Represents the number of people who have received the second dose in a two-dose COVID-19 vaccine series (such as the Pfizer or Moderna vaccines),) or one dose of the single-shot Johnson & Johnson’s Janssen vaccine.
Daily Change in the Total Number of Administered COVID-19 Vaccine Doses Reported to CDC by the Date of CDC Report, United States

7-Day moving average
Hospitalizations
New Hospital Admissions
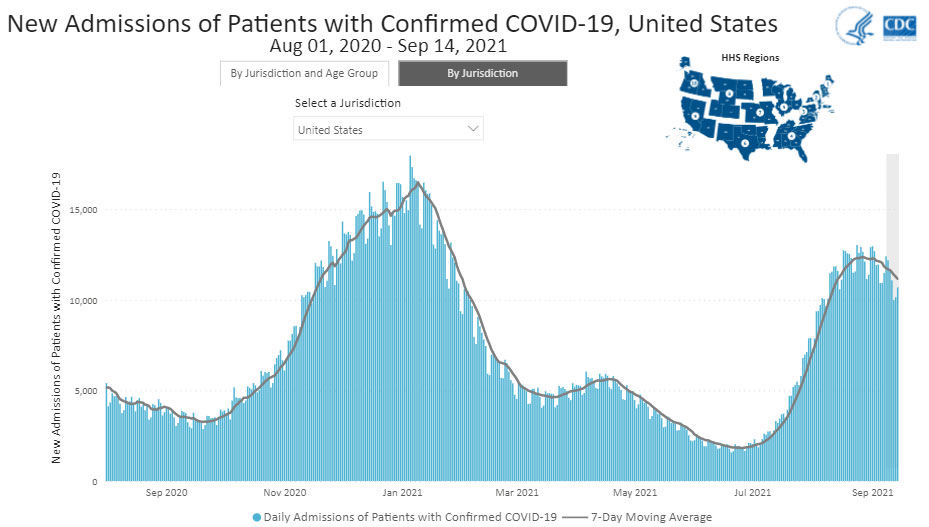
The current 7-day daily average for September 8–September 14, 2021, was 11,165. This is a 5.7% decrease from the prior 7-day average (11,836) from September 1–September 7, 2021.
2,920,532
Total New Admissions
2,920,532
Total New Admissions
11,165
Current 7-Day Average
11,165
Current 7-Day Average
11,836
Prior 7-Day Average
11,836
Prior 7-Day Average
-5.7%
Change in 7-Day Average
-5.7%
Change in 7-Day Average
The start of consistent reporting of hospital admissions data was August 1, 2020.
Daily Trends in Number of New COVID-19 Hospital Admissions in the United States
New admissions are pulled from a 10 am EST snapshot of the HHS Unified Hospital Timeseries Dataset. Due to potential reporting delays, data from the most recent 7 days, as noted in the figure above with the grey bar, should be interpreted with caution. Small shifts in historic data may also occur due to changes in the Centers for Medicare and Medicaid Services (CMS) Provider of Services file, which is used to identify the cohort of included hospitals.
COVID-NET: Trends in Hospitalization Rates in Children Ages 11 Years and Younger Not Eligible for Vaccination
CDC’s Coronavirus Disease 2019-Associated Hospitalization Surveillance Network (COVID-NET) shows that hospitalization rates are increasing, including rates in children ages 11 years and younger. Recent weekly rates of COVID-19-associated hospitalizations for these children are the highest they have ever been. Weekly rates in children ages 4 years and younger for the week ending August 28, 2021, are 2.4 per 100,000. Rates in children ages 5–11 years are 0.9 per 100,000 for weeks ending August 9 and August 21, 2021. Unlike adults, children younger than 12 years of age are not yet eligible for any of the available COVID-19 vaccines.
Trends in Hospitalization Rates in Children Ages 11 Years and Younger Not Eligible for Vaccination
The Coronavirus Disease 2019 (COVID-19)-Associated Hospitalization Surveillance Network (COVID-NET) is an additional source for hospitalization data collected through a network of more than 250 acute-care hospitals in 14 states (representing ~10% of the U.S. population). Detailed data on patient demographics, including race/ethnicity, underlying medical conditions, medical interventions, and clinical outcomes, are standardized case reporting form.
Deaths
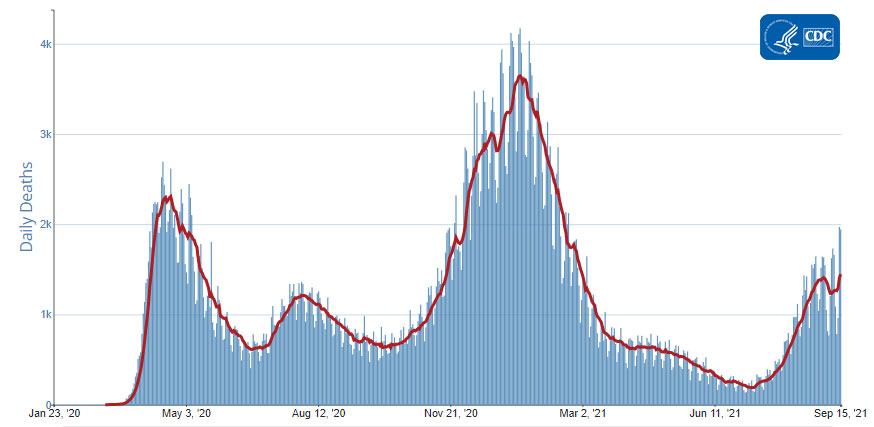
The current 7-day moving average of new deaths (1,448) has increased 17.4% compared with the previous 7-day moving average (1,233). As of September 15, 2021, a total of 666,440 COVID-19 deaths have been reported in the United States.
666,440
Total Deaths Reported
666,440
Total Deaths Reported
1,448
Current 7-Day Average*
1,448
Current 7-Day Average*
1,233
Prior 7-Day Average
1,233
Prior 7-Day Average
17.4%
Change in 7-Day Average Since Prior Week
17.4%
Change in 7-Day Average Since Prior Week
*Historical deaths are excluded from the daily new deaths and 7-day average calculations until they are incorporated into the dataset by their applicable date. Of 7,633 historical deaths reported retroactively, 202 were reported in the current week and 253 were reported in the prior week.
Daily Trends in Number of COVID-19 Deaths in the United States Reported to CDC

7-Day moving average
- Monitoring Incidence of COVID-19 Cases, Hospitalizations, and Deaths, by Vaccination Status — 13 U.S. Jurisdictions, April 4–July 17, 2021
- Interim Estimates of COVID-19 Vaccine Effectiveness Against COVID-19–Associated Emergency Department or Urgent Care Clinic Encounters and Hospitalizations Among Adults During SARS-CoV-2 B.1.617.2 (Delta) Variant Predominance — Nine States, June–August 2021
- Effectiveness of COVID-19 mRNA Vaccines Against COVID-19–Associated Hospitalization — Five Veterans Affairs Medical Centers, United States, February 1–August 6, 2021
- Disaggregating Data to Measure Racial Disparities in COVID-19 Outcomes and Guide Community Response — Hawaii, March 1, 2020–February 28, 2021
- Post-Acute Sequelae of SARS-CoV-2 Infection Among Adults Aged ≥18 Years — Long Beach, California, April 1–December 10, 2020
- Longitudinal Trends in Body Mass Index Before and During the COVID-19 Pandemic Among Persons Aged 2–19 Years — United States, 2018–2020
- Comparative Effectiveness of Moderna, Pfizer-BioNTech, and Janssen (Johnson & Johnson) Vaccines in Preventing COVID-19 Hospitalizations Among Adults Without Immunocompromising Conditions — United States, March–August 2021
Recent COVID Data Tracker Updates
- The Vaccination Among Pregnant People tab now shows the percent of people fully vaccinated prior to and during pregnancy, over time and by race/ethnicity
- New bivariate map on the Vaccination Equity tab displays vaccination coverage by metro/non-metro status, by county
- Crosslinks to CDC Vaccination Effectiveness Research webpage have been added to multiple tabs across the site
