Recommendations for Fully Vaccinated People
COVID-19 Homepage

Healthy Habits, Healthy Kids
Interpretive Summary for September 24, 2021
Healthy Habits, Healthy Kids
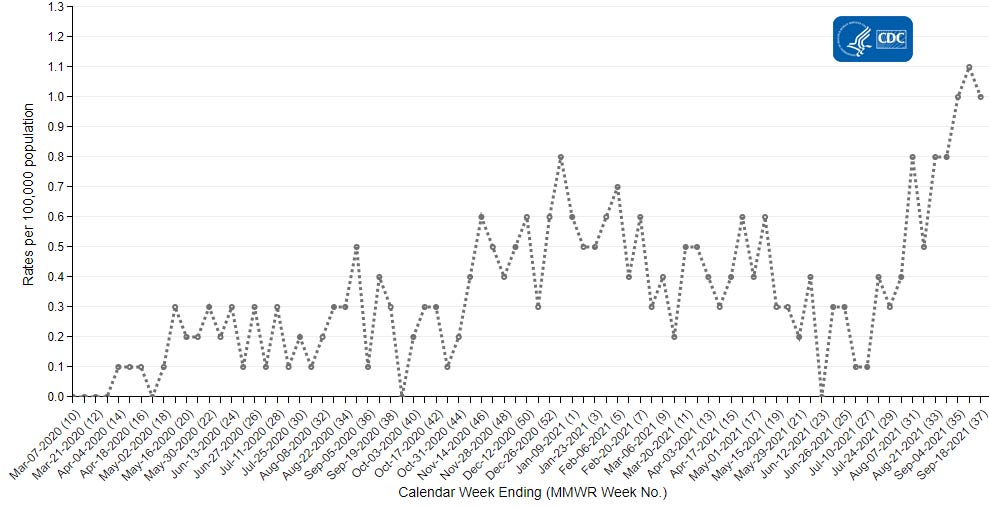
Fewer cases of COVID-19 have been reported in children (ages 0-17 years) compared with adults.1–3 Rates of COVID-19-associated hospitalizations are also lower in children than in adults. However, weekly rates of hospitalizations due to COVID-19 have recently increased in children ages 11 years and younger. In fact, these hospitalization rates are the highest they have been since the start of the pandemic. The increases come as many schools across the country have resumed in-person learning.
Because children can be affected by COVID-19 and have severe complications, schools are encouraged to implement CDC’s Guidance for COVID-19 Prevention in K-12 Schools to keep children safe. Consistent and correct mask use is a critical strategy to reduce the spread of COVID-19 among children in K-12 school settings. Two recent CDC studies found that counties without school mask requirements had higher increases in rates of COVID-19 cases in children than schools with mask requirements.4,5
To prevent COVID-19 outbreaks in schools, CDC recommends layered prevention strategies, including universal indoor masking, screening testing, physical distancing, and vaccination. Everyone in the United States 12 years and older is eligible to receive a COVID-19 vaccine, yet vaccination coverage among children ages 12-17 years is lower than in older groups.6 If you have questions about COVID-19 vaccines for children and teens, talk with your child’s doctor or preferred healthcare provider. In addition, children are better protected when the adults around them are vaccinated. To find a vaccine provider near you, visit Vaccines.gov or your state or local public health department website.
Note to readers: CDC’s COVID Data Tracker’s new Pediatric Data page shows data and visualizations for children at the national, state, and community level. Data and maps highlighting COVID-19 trends in children ages 0-17 years can help demonstrate the impact of the pandemic on this age group. These data are important for understanding how children are affected by COVID-19. Data can also inform the actions needed to prevent the spread of COVID-19 among children and those who interact with them.
Reported Cases
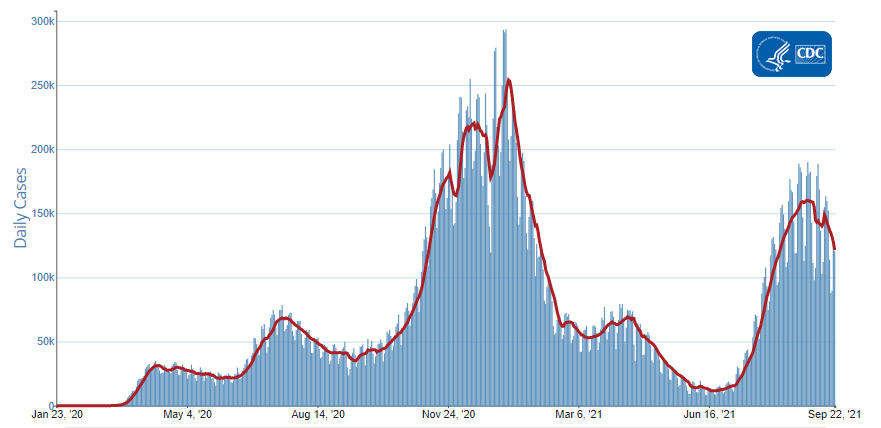
The current 7-day moving average of daily new cases (121,533) decreased 17.1% compared with the previous 7-day moving average (146,684). A total of 42,501,643 COVID-19 cases have been reported as of September 22, 2021.
42,501,643
Total Cases Reported
42,501,643
Total Cases Reported
121,533
Current 7-Day Average*
121,533
Current 7-Day Average*
146,684
Prior 7-Day Average
146,684
Prior 7-Day Average
-17.1%
Change in 7-Day Average since Prior Week
-17.1%
Change in 7-Day Average since Prior Week
*Historical cases are excluded from daily new cases and 7-day average calculations until they are incorporated into the dataset for the applicable date. Of 121,817 historical cases reported retroactively, 5,404 were reported in the current week and 5,796 were reported in the prior week.
Daily Trends in COVID-19 Cases in the United States Reported to CDC

7-Day moving average
SARS-CoV-2 Variants
Currently, the Delta variant is the only variant classified as a variant of concern (VOC) in the United States. The U.S. Government SARS-CoV-2 Interagency Group recently downgraded the Alpha, Beta, and Gamma variants to Variants Being Monitored (VBM). These variants do not pose a significant and imminent risk to public health in the United States due to their very low prevalence, which is currently estimated to be less than 0.1%.
Nowcast projections* for the week ending September 18, 2021, estimate the national proportion of cases attributed to the Delta variant to be greater than 98%. Nowcast estimates indicate that Delta will continue to be the predominant variant circulating in all 10 U.S. Department of Health and Human Services (HHS) regions, circulating at greater than 98%.
*The median time from specimen collection to sequence data reporting is about 3 weeks. As a result, weighted estimates for the most recent few weeks may be unstable or unavailable. CDC’s Nowcast is a data projection tool that helps fill this gap by generating timely estimates of variant proportions for variants that are circulating in the United States. View Nowcast estimates on Variant Proportions page.
Testing
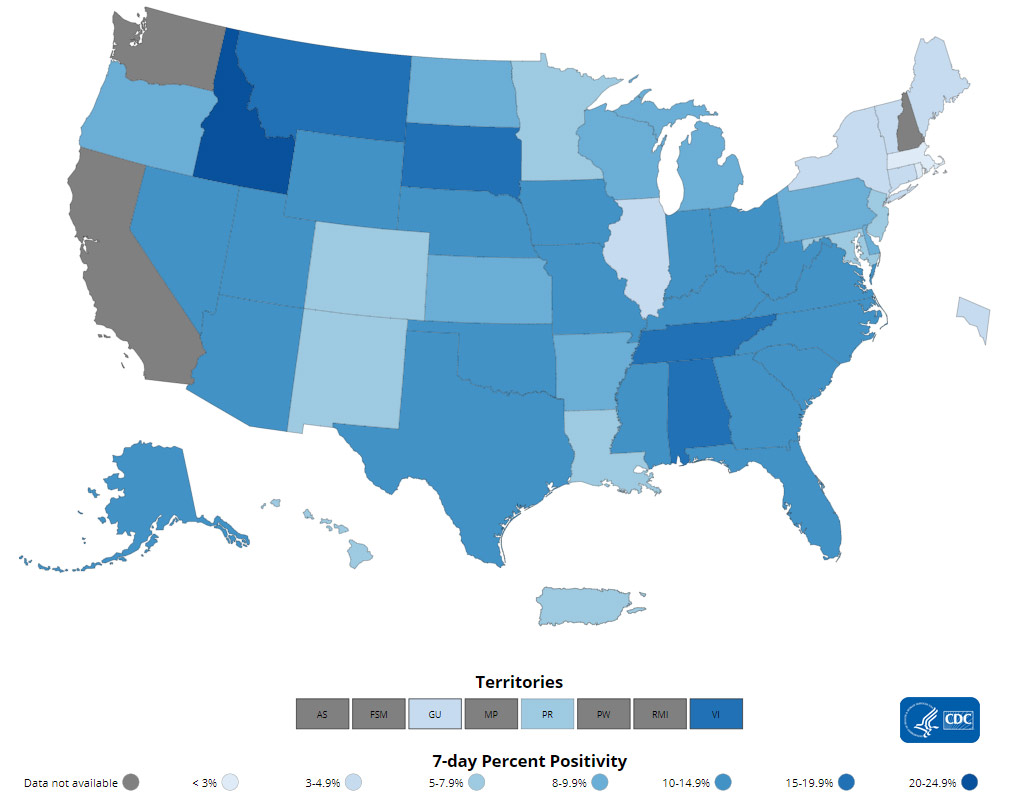
The percentage of COVID-19 NAATs (nucleic acid amplification tests)* that are positive (percent positivity) has decreased from the previous week. The 7-day average of percent positivity from NAATs is now 7.6%. The 7-day average number of tests reported for September 10 –September 16, 2021, was 1,649,785, up 11.9% from 1,474,550 for the prior 7 days.
564,226,284
Total Tests Reported
564,226,284
Total Tests Reported
1,649,785
7-Day Average Tests Reported
1,649,785
7-Day Average Tests Reported
7.6%
7-Day Average % Positivity
7.6%
7-Day Average % Positivity
8.5%
Previous 7-Day Average % Positivity
8.5%
Previous 7-Day Average % Positivity
-10.8%
Change in 7-Day Average % Positivity since Prior Week
-10.8%
Change in 7-Day Average % Positivity since Prior Week
*Test for SARS-CoV-2, the virus that causes COVID-19
COVID-19 NAAT Laboratory Test 7-day Percent Positivity by State/Territory
Vaccinations
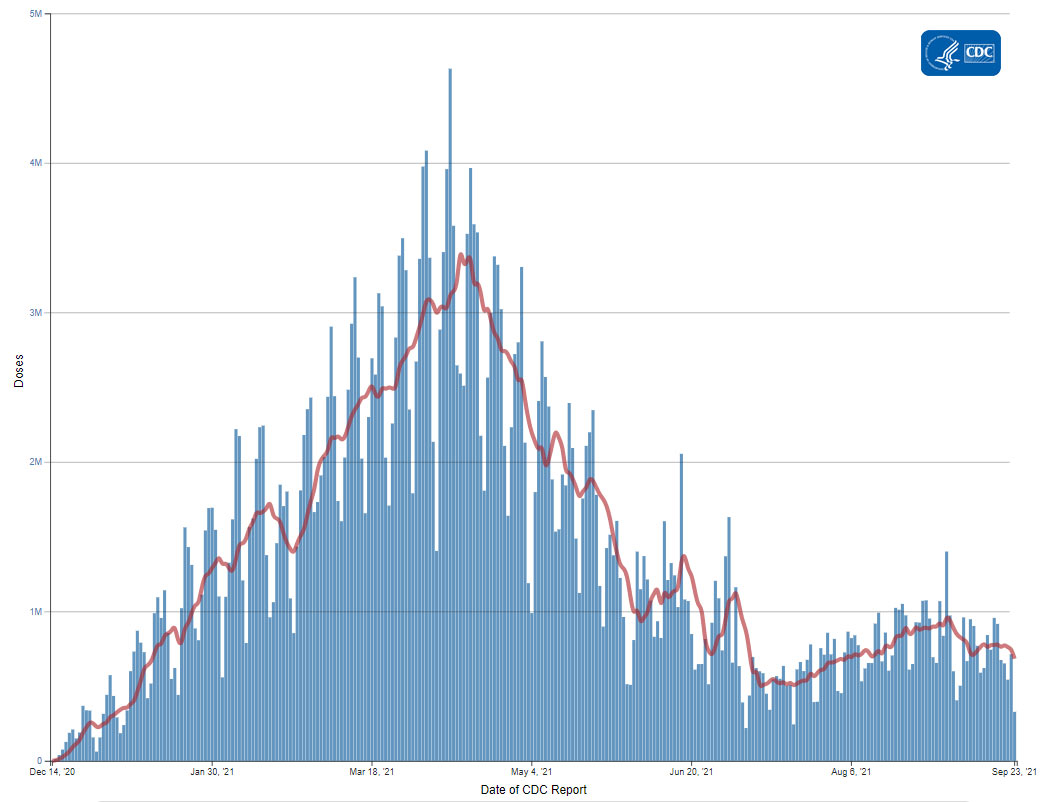
The U.S. COVID-19 Vaccination Program began December 14, 2020. As of September 23, 2021, 387.8 million vaccine doses have been administered. Overall, about 212.6 million people, or 64% of the total U.S. population, have received at least one dose of vaccine. About 182.6 million people, or 55% of the total U.S. population, have been fully vaccinated.* As of September 23, 2021, the 7-day average number of administered vaccine doses reported (by date of CDC report) to CDC per day was 683,329, a 11.7% decrease from the previous week.
CDC’s COVID Data Tracker Vaccination Demographic Trends tab shows vaccination trends by age group. As of September 23, 2021, 93.3% of people ages 65 years or older have received at least one dose of vaccine and 83% are fully vaccinated. Over three-quarters (76.7%) of people ages 18 years or older have received at least one dose of vaccine and 66.2% are fully vaccinated. For people ages 12 years or older, 74.9% have received at least one dose of vaccine and 64.3% are fully vaccinated.
387,821,704
Vaccines Administered
387,821,704
Vaccines Administered
212,564,346
People who received at least one dose
212,564,346
People who received at least one dose
182,587,334
People who are fully vaccinated*
182,587,334
People who are fully vaccinated*
64%
Percentage of the US population that has received at least one dose
64%
Percentage of the US population that has received at least one dose
55%
Percentage of the US population that has been fully vaccinated*
55%
Percentage of the US population that has been fully vaccinated*
+0.5
Percentage point increase from last week
+0.5
Percentage point increase from last week
+0.8
Percentage point increase from last week
+0.8
Percentage point increase from last week
*Represents the number of people who have received the second dose in a two-dose COVID-19 vaccine series (such as the Pfizer or Moderna vaccines) or one dose of the single-shot Johnson & Johnson’s Janssen vaccine.
Daily Change in the Total Number of Administered COVID-19 Vaccine Doses Reported to CDC by the Date of CDC Report, United States

7-Day moving average
Hospitalizations
New Hospital Admissions
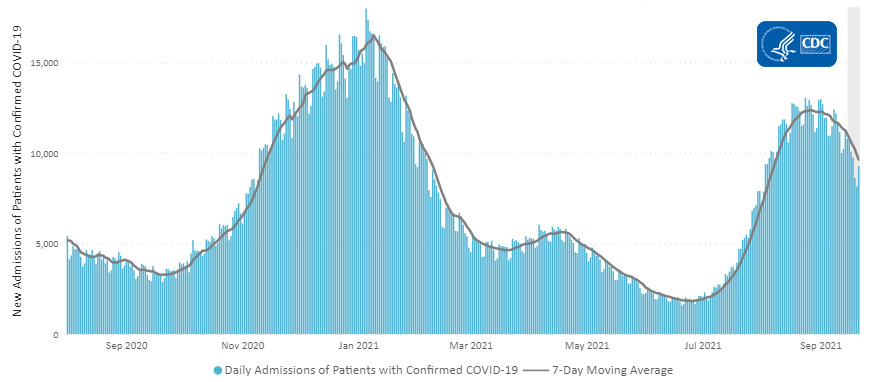
The current 7-day daily average for September 15–September 21, 2021, was 9,636. This is a 14.4% decrease from the prior 7-day average (11,255) from September 8–September 14, 2021.
2,988,684
Total New Admissions
2,988,684
Total New Admissions
9,636
Current 7-Day Average
9,636
Current 7-Day Average
11,255
Prior 7-Day Average
11,255
Prior 7-Day Average
-14.4%
Change in 7-Day Average
-14.4%
Change in 7-Day Average
The start of consistent reporting of hospital admissions data was August 1, 2020.
Daily Trends in Number of New COVID-19 Hospital Admissions in the United States
New admissions are pulled from a 10 am EST snapshot of the HHS Unified Hospital Timeseries Dataset. Due to potential reporting delays, data from the most recent 7 days, as noted in the figure above with the grey bar, should be interpreted with caution. Small shifts in historic data may also occur due to changes in the Centers for Medicare and Medicaid Services (CMS) Provider of Services file, which is used to identify the cohort of included hospitals.
COVID-NET: Trends in Hospitalization Rates in Children Ages 5–11 Years Not Eligible for Vaccination
CDC’s Coronavirus Disease 2019-Associated Hospitalization Surveillance Network (COVID-NET) shows that hospitalization rates are increasing, including rates in school-aged children ages 5–11 years. Recent weekly rates of COVID-19-associated hospitalizations for these children are the highest they have ever been. Rates in children ages 5–11 years are 1.0 per 100,000 for the week ending September 4, 2021. Unlike adolescents ages 12–17 years, children ages 5–11 years are not yet eligible for any of the available COVID-19 vaccines.
Trends in Hospitalization Rates in Children Ages 5–11 Years Not Eligible for Vaccination
The Coronavirus Disease 2019 (COVID-19)-Associated Hospitalization Surveillance Network (COVID-NET) is an additional source for hospitalization data collected through a network of more than 250 acute-care hospitals in 14 states (representing ~10% of the U.S. population). Detailed data on patient demographics, including race/ethnicity, underlying medical conditions, medical interventions, and clinical outcomes, are standardized case reporting form.
Deaths
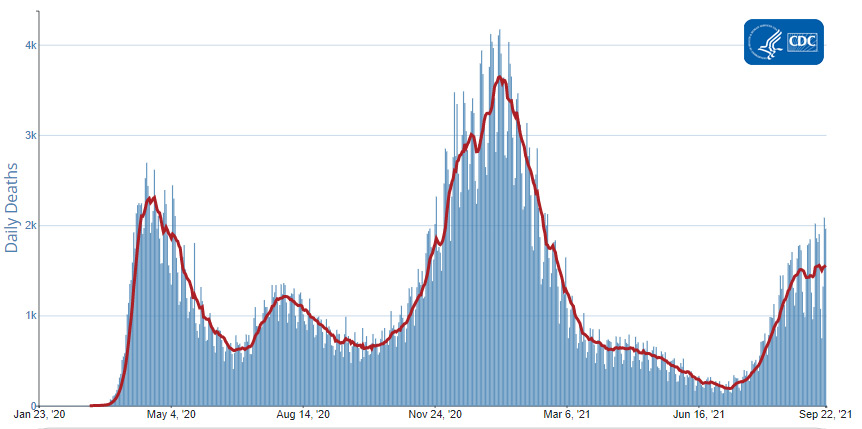
The current 7-day moving average of new deaths (1,557) has increased 0.7% compared with the previous 7-day moving average (1,545). As of September 22, 2021, a total of 680,688 COVID-19 deaths have been reported in the United States.
680,688
Total Deaths Reported
680,688
Total Deaths Reported
1,557
Current 7-Day Average*
1,557
Current 7-Day Average*
1,545
Prior 7-Day Average
1,545
Prior 7-Day Average
0.7%
Change in 7-Day Average Since Prior Week
0.7%
Change in 7-Day Average Since Prior Week
*Historical deaths are excluded from the daily new deaths and 7-day average calculations until they are incorporated into the dataset by their applicable date. Of 7,899 historical deaths reported retroactively, 208 were reported in the current week; and 240 were reported in the prior week.
Daily Trends in Number of COVID-19 Deaths in the United States Reported to CDC

7-Day moving average
- CDC. COVID Data Tracker: Demographic Trends of COVID-19 cases and deaths in the US reported to CDC. Atlanta, GA: US Department of Health and Human Services, CDC; 2021. https://covid.cdc.gov/covid-data-tracker/#demographics.
- Stokes EK, Zambrano LD, Anderson KN, et al. Coronavirus Disease 2019 Case Surveillance – United States, January 22-May 30, 2020. MMWR. 2020;69:759-765. doi:10.15585/mmwr.mm6924e2.
- Williams N, Radia T, Harman K, et al. COVID-19 Severe Acute Respiratory Syndrome Coronavirus 2 (SARS-CoV-2) Infection in Children and Adolescents: A Systematic Review of Critically Unwell Children and the Association With Underlying Comorbidities. Eur J Pediatr. 2020;10:1-9. doi:10.1007/s00431-020-03801-6External
- COVID-19 Pediatric Cases in Counties with and without School Mask Requirements — United States, July 1, 2021 to September 4, 2021
- Association Between K–12 School Mask Policies and School-Associated COVID-19 Outbreaks — Maricopa and Pima Counties, Arizona, July–August 2021
- CDC. COVID Data Tracker: Percent of People Receiving COVID-19 Vaccine by Age and Date Reported to CDC, United States. Atlanta, GA: US Department of Health and Human Services, CDC; 2021. https://covid.cdc.gov/covid-data-tracker/#vaccination-demographics-trends.
- Use of Pfizer-BioNTech COVID-19 Vaccine in Persons Aged ≥16 Years: Recommendations of the Advisory Committee on Immunization Practices — United States, September 2021
- Outbreak of SARS-CoV-2 B.1.617.2 (Delta) Variant Infections Among Incarcerated Persons in a Federal Prison — Texas, July–August 2021
- COVID-19–Related School Closures and Learning Modality Changes — United States, August 1–September 17, 2021
- COVID-19 Pediatric Cases in Counties with and without School Mask Requirements — United States, July 1, 2021 to September 4, 2021
- Association Between K–12 School Mask Policies and School-Associated COVID-19 Outbreaks — Maricopa and Pima Counties, Arizona, July–August 2021
- Decreased Incidence of Infections Caused by Pathogens Transmitted Commonly Through Food During the COVID-19 Pandemic — Foodborne Diseases Active Surveillance Network, 10 U.S. Sites, 2017–2020
Recent COVID Data Tracker Updates
- State-level metrics and links to new county datasets available on data.cdc.gov have been added to the County View tab
- The Vaccination Among Pregnant People tab now shows the percent of people fully vaccinated prior to and during pregnancy, over time and by race/ethnicity
- New bivariate map on the Vaccination Equity tab displays vaccination coverage by metro/non-metro status, by county

