Recommendations for Fully Vaccinated People
COVID-19 Homepage
The Update on “Up to Date”
Interpretive Summary for September 30, 2022

The Update on “Up to Date”
Since CDC recommended the updated (bivalent) COVID-19 boosters earlier this month, 7.6 million eligible people in the United States have gotten one. Bivalent boosters help restore protection that might have gone down since your last dose—and they also give extra protection for you and those around you against all lineages of the Omicron variant. Both ModernaExternal and PfizerExternal offer bivalent boosters.
The introduction of the new boosters has caused some changes in vaccine recommendations, which are based on your age, the vaccine you first received, and time since your last dose. You are up to date with your COVID-19 vaccines if you have completed a COVID-19 vaccine primary series and received the most recent booster dose recommended for you by CDC. Here’s the breakdown:
- People ages 6 months through 4 years should get all COVID-19 primary series doses.
- People ages 5 years and older should get all primary series doses, and the booster dose recommended for them by CDC.
- People ages 5 to 11 years are currently recommended to get the original (monovalent) booster.
- People ages 12 years and older are recommended to receive the updated Pfizer or Moderna bivalent booster.
- This includes people who have received all primary series doses and people who have previously received one or more original boosters.
- At this time, people ages 12 to 17 years can only receive the updated Pfizer bivalent booster.
- People who are moderately or severely immunocompromised have different recommendations for COVID-19 vaccines.
The more people who stay up to date on their vaccinations, the better chance we have of avoiding a possible surge in COVID-19 illness later this fall and winter. Use this tool to determine when or if you (or your child) can get one or more COVID-19 boosters.
Note to Readers: CDC will not publish COVID Data Tracker Weekly Review on Friday, October 7, 2022. Publication will resume on Friday, October 14, 2022
- COVID Data Tracker’s Vaccinations in the US page was updated to include bivalent booster dose data. Additionally, the “Vaccine Administration by Vaccine Type” and “Vaccine Distribution by Vaccine Type” charts were relabeled with “Pfizer/Moderna original” and “Pfizer/Moderna updated booster.”
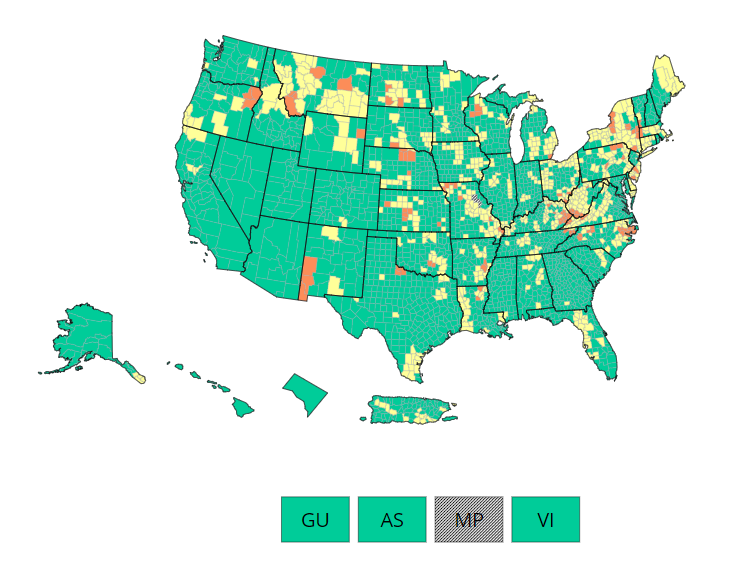
COVID-19 Community Levels*
As of September 29, 2022, there are 107 (3.3%) counties, districts, or territories with a high COVID-19 Community Level, 737 (22.9%) counties with a medium Community Level, and 2,373 (73.7%) counties with a low Community Level. Compared with last week, this represents a moderate decrease (−3.7 percentage points) in the number of high-level counties, a large decrease (-8.3 percentage points) in the number of medium-level counties, and a large increase (+12.0 percentage points) in the number of low-level counties. Overall, 45 out of 52 jurisdictions** had high- or medium-level counties this week. Arizona, the District of Columbia, Hawaii, Nevada, New Mexico, Rhode Island, and Utah are the only jurisdictions to have all counties at low Community Levels.
To check your COVID-19 Community Level, visit COVID Data Tracker. To learn which prevention measures are recommended based on your COVID-19 Community Level, visit COVID-19 Community Level and COVID-19 Prevention.
*CDC recommends use of COVID-19 Community Levels to determine the impact of COVID-19 on communities and to take action. CDC also provides Community Transmission Levels to describe the amount of COVID-19 spread within each county. Healthcare facilities use Community Transmission Levels to determine infection control interventions.
**Includes the 50 states, the District of Columbia, and U.S. territories.

Reported Cases
As of September 28, 2022, the current 7-day moving average of daily new cases (47,112) decreased 13.1% compared with the previous 7-day moving average (54,202). A total of 96,052,716 COVID-19 cases have been reported in the United States as of September 28, 2022.
Variant Proportions
CDC Nowcast projections* for the week ending October 1, 2022, estimate that the combined national proportion of lineages designated as Omicron will continue to be 100%. There are five sublineages designated as Omicron: BA.5, BA.4.6, BF.7, BA.2.75, and BA.4. The predominant Omicron lineage is BA.5, projected to be 81.3% (95% PI 79.6-83.0%).
The national proportion of BA.4.6 is projected to be 12.8% (95% PI 11.5-14.1%), BF.7 is projected to be 3.4% (95% PI 2.6-4.4%), BA.2.75 is projected to be 1.4% (95% PI 1.1-1.9%), and BA.4 is projected to be 1.1% (95% PI 1.0-1.2%. See COVID Data Tracker for current data.
96,052,716
Total Cases Reported
47,112
Current 7-Day Average**
54,202
Previous 7-Day Average
-13.1%
Change in 7-Day Average since Previous Week
*CDC uses Nowcast projections to predict current variant proportions circulating in the United States. The median time from specimen collection to sequence data reporting is about 3 weeks. As a result, weighted estimates for the most recent few weeks may be unstable or unavailable. View Nowcast estimates on CDC’s COVID Data Tracker website on the Variant Proportions page.
**Historical cases are excluded from daily new cases and 7-day average calculations until they are incorporated into the dataset for the applicable date. Of 670,655 historical cases reported retroactively, 11,753 were reported in the current week and none were reported in the prior week.
Daily Trends in COVID-19 Cases in the United States Reported to CDC

7-Day moving average

Vaccinations
COVID-19 Vaccine Primary Series
As of September 28, 2022, 619.8 million vaccine doses have been administered in the United States. Overall, about 264.1 million people, or 79.5% of the total U.S. population, have received at least one dose of vaccine. About 225.3 million people, or 67.9% of the total U.S. population, have completed a primary series.*
619,765,972
Vaccine Doses Administered
264,112,767
People who received at least one dose (79.5% of the U.S. population)
225,284,115
People who are fully vaccinated* (67.9% of the U.S. population)
+0.0
Percentage point change from last week
+0.1
Percentage point change from last week
*Represents the number of people who have received the second dose in a two-dose COVID-19 vaccine series (such as the Pfizer-BioNTech, Moderna, or Novavax vaccines) or one dose of the single-shot Johnson & Johnson’s Janssen vaccine.
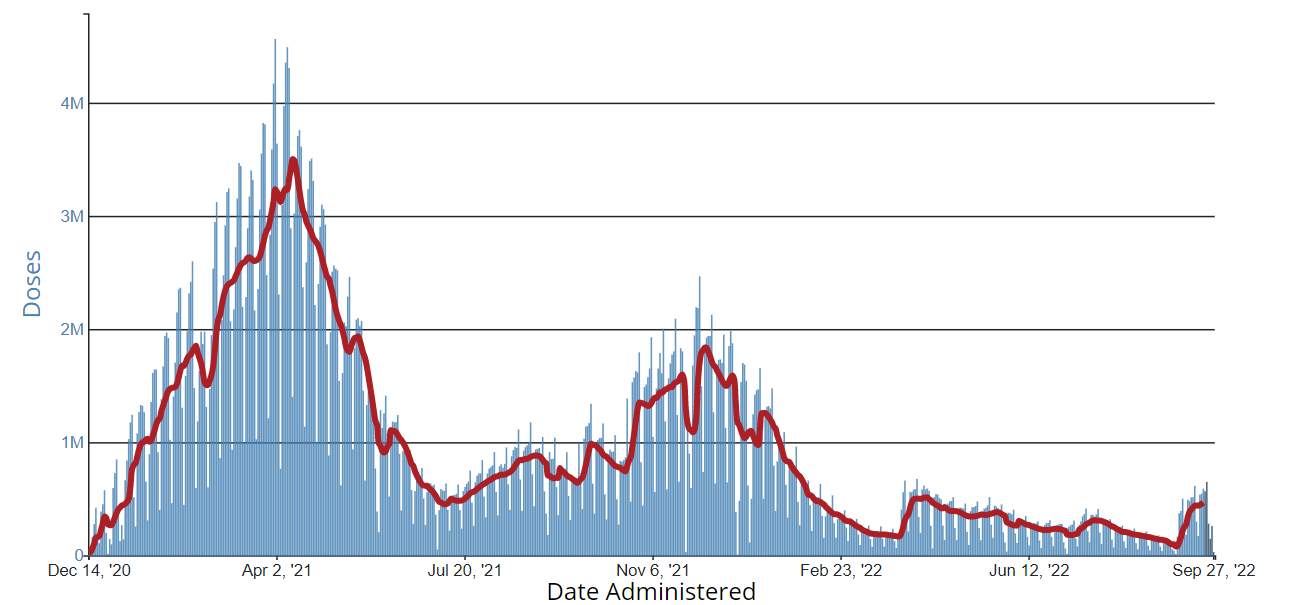
Daily Change in the Total Number of Administered COVID-19 Vaccine Doses Reported to CDC by the Date of Administration, United States
7-Day moving average
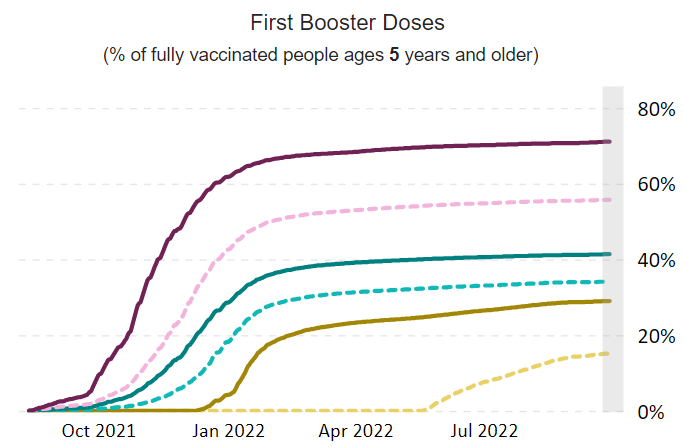
COVID-19 Vaccine Boosters
Of those who have completed a primary series, about 110.0 million people have received a booster dose,* and more than 7.5 million people have received an updated (bivalent) booster dose. But 49.8% of the total booster-eligible population has not yet received a booster dose. Booster dose eligibility varies by age and health condition. Learn more about who is eligible.
136,601,541
Booster Doses Administered
109,967,267
Population ≥ 5 Years of Age with a 1st booster dose*
23,869,248
Population ≥ 50 Years of Age with a 2nd booster dose**
48.9%
Percentage of the Population ≥ 5 Years of Age with a 1st booster dose
36.6%
Percentage of the Population ≥ 50 Years of Age with a 2nd booster dose
+0.1
Percentage point change from last week
+1.1
Percentage point change from last week
*Represents the number of people who are fully vaccinated and have received another dose of COVID-19 vaccine since August 13, 2021. This includes people who received their first additional dose or booster dose.
**Represents the number of people who are fully vaccinated and have received two subsequent doses of COVID-19 vaccine since August 13, 2021. This includes people who received two booster doses and people who received one additional dose and one booster dose.
COVID-19 Booster Dose Administration, United States


5,353,767
Total New Admissions
3,773
Current 7-Day Average
4,029
Prior 7-Day Average
-7.4%
Change in 7-Day Average
The start of consistent reporting of hospital admissions data was August 1, 2020.
Daily Trends in Number of New COVID-19 Hospital Admissions in the United States
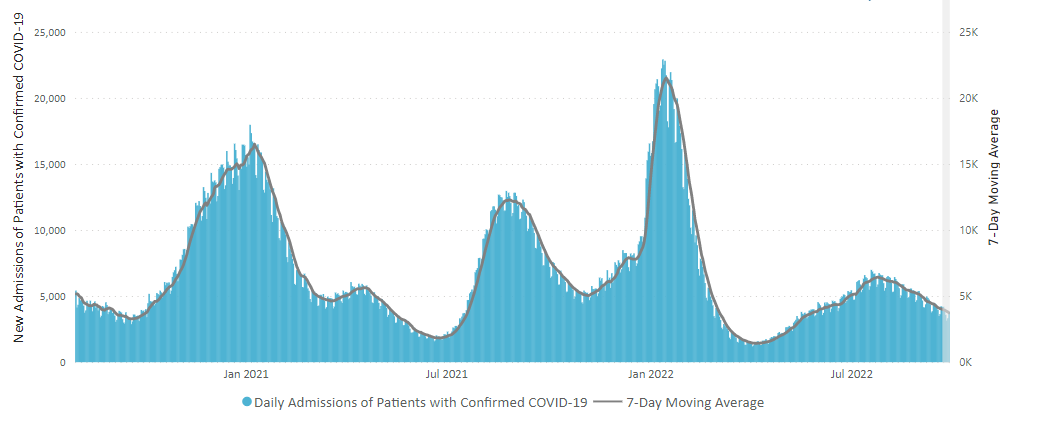
New admissions are pulled from a 10 am EDT snapshot of the HHS Unified Hospital Data – Analytic Dataset. Due to potential reporting delays, data from the most recent 7 days, as noted in the figure above with the grey bar, should be interpreted with caution. Small shifts in historic data may also occur due to changes in the Centers for Medicare & Medicaid Services (CMS) Provider of Services file, which is used to identify the cohort of included hospitals.
COVID-NET: Hospitalization Rates among Adults 85 Years and Older
CDC’s Coronavirus Disease 2019-Associated Hospitalization Surveillance Network (COVID-NET) shows that COVID-19-associated hospitalizations are highest among adults ages 85 years and older. However, rates (per 100,000 population) have decreased by 25% over the past month, from 83.1 for the week ending August 6, 2022, to 62.0 for the week ending September 10, 2022.
Weekly Rates of COVID-19-Associated Hospitalizations among Adults Ages 85 Years and Older

The Coronavirus Disease 2019 (COVID-19)-Associated Hospitalization Surveillance Network (COVID-NET) is an additional source for hospitalization data collected through a network of more than 250 acute-care hospitals in 14 states (representing ~10% of the U.S. population). Detailed data on patient demographics, including race/ethnicity, underlying medical conditions, medical interventions, and clinical outcomes, are collected using a standardized case reporting form.
Deaths
The current 7-day moving average of new deaths (344) decreased 6.7% compared with the previous 7-day moving average (368). As of September 28, 2022, a total of 1,053,173 COVID-19 deaths have been reported in the United States.
1,053,173
Total Deaths Reported
344
Current 7-Day Average*
368
Prior 7-Day Average
-6.7%
Change in 7-Day Average Since Prior Week
*Historical deaths are excluded from the daily new deaths and 7-day average calculations until they are incorporated into the dataset by their applicable date. Of 22,233 historical deaths reported retroactively, 483 were reported in the current week; and none were reported in the prior week.
Daily Trends in Number of COVID-19 Deaths in the United States Reported to CDC
7-Day moving average
 More Death Data
Testing
The percentage of COVID-19 NAATs (nucleic acid amplification tests)* that are positive is increasing in comparison to the previous week. The 7-day average of percent positivity from NAATs is now 9.8%. The 7-day average number of tests reported for September 16–22, 2022, was 400,255, down 16.7% from 480,510 for the prior 7 days.
961,853,873
Total Tests Reported
400,255
7-Day Average Tests Reported
9.8%
7-Day Average % Positivity
9.6%
Previous 7-Day Average % Positivity
+0.16
Percentage point change in 7-Day Average % Positivity since Prior Week
*Test for SARS-CoV-2, the virus that causes COVID-19
COVID-19 NAAT Laboratory Test 7-day Percent Positivity by State/Territory

Wastewater Surveillance
COVID Data Tracker’s Wastewater Surveillance tab tracks levels, changes, and detections of SARS-CoV-2* viral RNA in wastewater at over 1,250 testing sites across the country. Currently, most of the country is reporting moderate to high SARS-CoV-2 levels in wastewater. About 16% of sites reporting wastewater data are currently seeing some of the highest levels for those sites since December 1, 2021. About 53% of sites are experiencing a decrease in SARS-CoV-2 levels, and about 41% are reporting an increase. It’s important to note that even a small increase when levels are low can appear like a dramatic increase in the percent change
For more information on how to use wastewater data, visit CDC’s website.
*The virus that causes COVID-19
SARS-CoV-2 Levels in Wastewater by Site
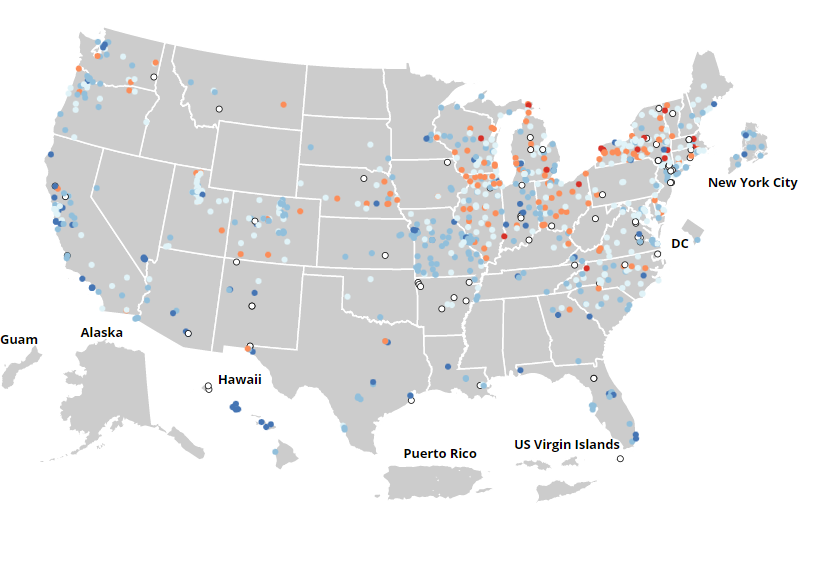

0% denotes that levels are the lowest they have been at the site; 100% denotes that levels are the highest they have been at the site.