Recommendations for Fully Vaccinated People
COVID-19 Homepage

Three Point Shot
Interpretive Summary for October 1, 2021
Three Point Shot
Last week the U.S. Food and Drug AdministrationExternal (FDA) issued an emergency use authorization (EUA) for a single booster shot* of the Pfizer-BioNTech COVID-19 vaccine. Certain populations are now eligible to receive a booster shot of the Pfizer-BioNTech vaccine at least 6 months after receiving their second Pfizer-BioNTech shot. These populations include people ages 65 years and older, people ages 18 years and older who have underlying medical conditions, and people ages 18 years and older who live or work in high-risk settings.
The COVID-19 vaccines approved and authorized in the United States continue to be effective at reducing the risk of severe disease, hospitalization, and death. COVID-19 vaccination can also reduce the spread of disease overall and help protect the people around you. However, recent data show that protection against asymptomatic, mild, and moderate disease may decrease over time. The reduced protection may be due to both decreasing immunity over time and the highly contagious Delta variant.
COVID-19 vaccination, along with layered prevention strategies, continues to be our best defense against severe disease. People who are unvaccinated remain the most vulnerable to COVID-19. To end this pandemic, it is critical that all people get vaccinated as soon as they are eligible. To find a vaccine provider near you, visit Vaccines.gov or your state or local public health department website. Talk to your healthcare provider if you have questions about whether a Pfizer-BioNTech COVID-19 booster shot is appropriate for you.
*Booster shots are doses of U.S. approved or authorized vaccines that are given when protection from initial vaccination is likely to have decreased over time.
Note to readers: CDC’s COVID Data Tracker recently released a COVID-19 Vaccine Effectiveness page, which allows users to view COVID-19 vaccine effectiveness at protecting against hospitalization and infection.
Reported Cases
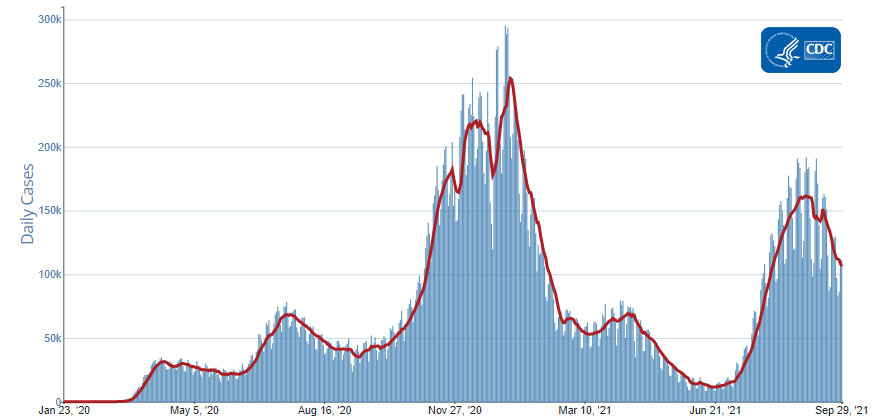
The current 7-day moving average of daily new cases (106,395) decreased 13.3% compared with the previous 7-day moving average (122,659). A total of 43,289,203 COVID-19 cases have been reported as of September 29, 2021.
43,289,203
Total Cases Reported
43,289,203
Total Cases Reported
106,395
Current 7-Day Average*
106,395
Current 7-Day Average*
122,659
Prior 7-Day Average
122,659
Prior 7-Day Average
-13.3%
Change in 7-Day Average since Prior Week
-13.3%
Change in 7-Day Average since Prior Week
*Historical cases are excluded from daily new cases and 7-day average calculations until they are incorporated into the dataset for the applicable date. Of 106,512 historical cases reported retroactively, 6,168 were reported in the current week and 2,835 were reported in the prior week.
Daily Trends in COVID-19 Cases in the United States Reported to CDC

7-Day moving average
SARS-CoV-2 Variants
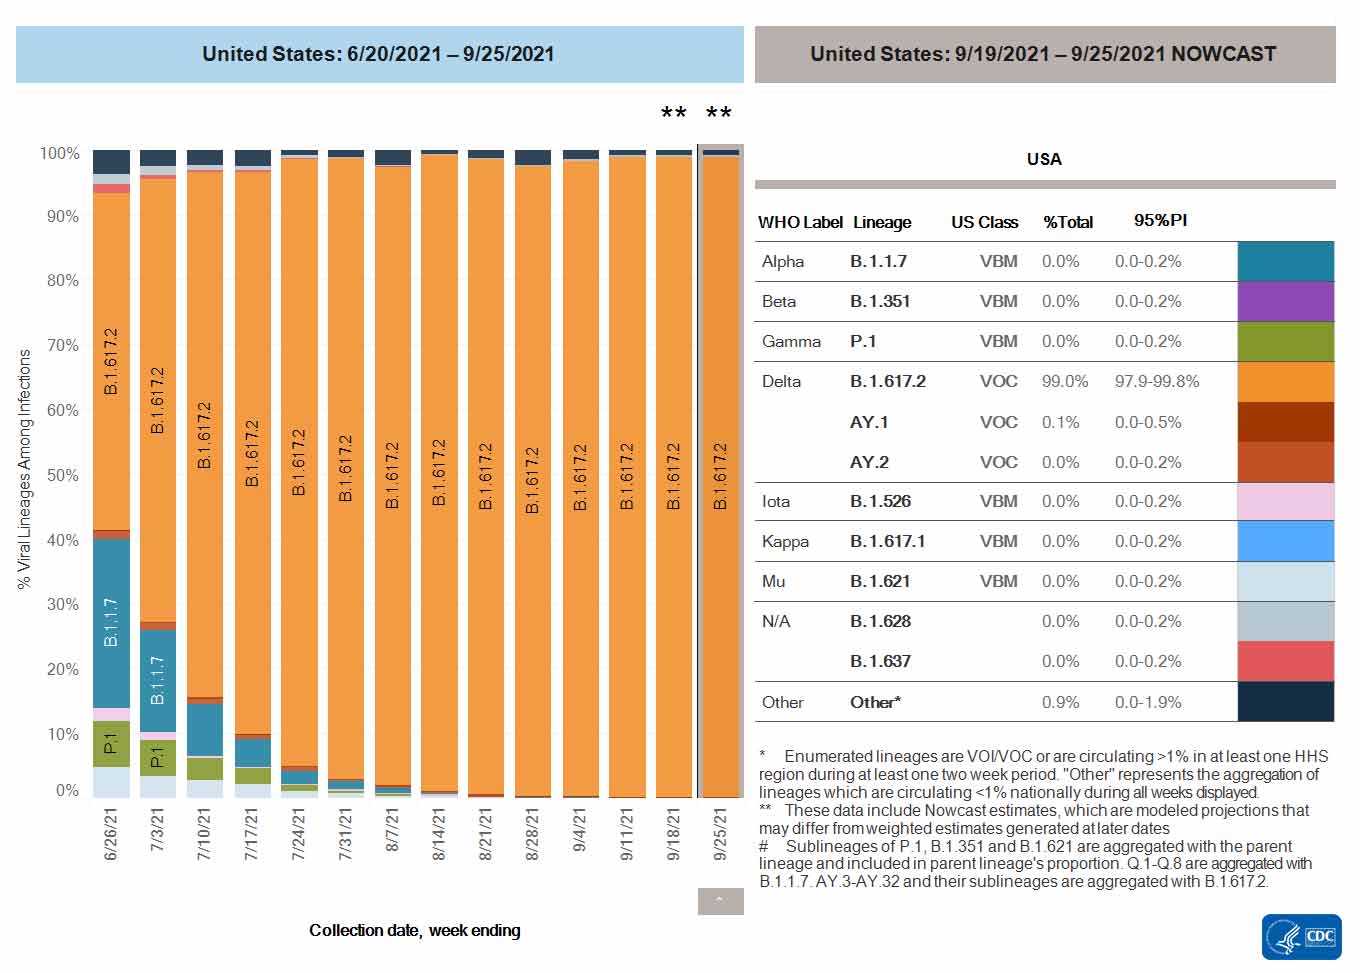
Currently, the Delta variant is the only variant classified as a Variant of Concern (VOC) in the United States. There are no variants classified as a Variant of Interest (VOI) and there are 10 variants classified as Variants Being Monitored (VBM). VBM do not pose a significant and imminent risk to public health in the United States due to their very low prevalence, which is currently estimated to be less than 0.1%.
Nowcast projections* for the week ending September 25, 2021, estimate the national proportion of cases attributed to the Delta variant to be greater than 99%. Nowcast estimates indicate that Delta will continue to be the predominant variant circulating in all 10 U.S. Department of Health and Human Services (HHS) regions, circulating at greater than 98%.
*The median time from specimen collection to sequence data reporting is about 3 weeks. As a result, weighted estimates for the most recent few weeks may be unstable or unavailable. CDC’s Nowcast is a data projection tool that helps fill this gap by generating timely estimates of variant proportions for variants that are circulating in the United States. View Nowcast estimates on CDC’s COVID Data Tracker website on the Variant Proportions page.
Testing
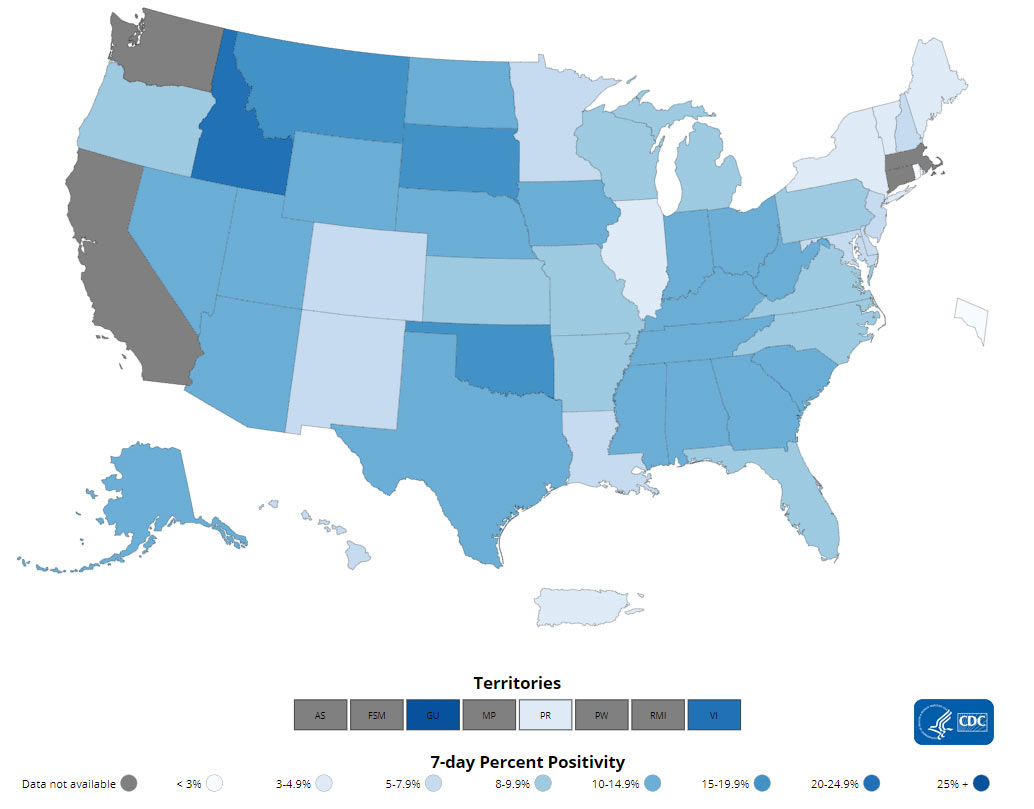
The percentage of COVID-19 NAATs (nucleic acid amplification tests)* that are positive (percent positivityExternal) has decreased from the previous week. The 7-day average of percent positivity from NAATs is now 6.6%. The 7-day average number of tests reported for September 17 – September 23, 2021, was 1,600,474, down 5.4% from 1,690,941 for the prior 7 days.
575,728,015
Total Tests Reported
575,728,015
Total Tests Reported
1,600,474
7-Day Average Tests Reported
1,600,474
7-Day Average Tests Reported
6.6%
7-Day Average % Positivity
6.6%
7-Day Average % Positivity
7.4%
Previous 7-Day Average % Positivity
7.4%
Previous 7-Day Average % Positivity
-11.1%
Change in 7-Day Average % Positivity since Prior Week
-11.1%
Change in 7-Day Average % Positivity since Prior Week
*Test for SARS-CoV-2, the virus that causes COVID-19
COVID-19 NAAT Laboratory Test 7-day Percent Positivity by State/Territory
Vaccinations
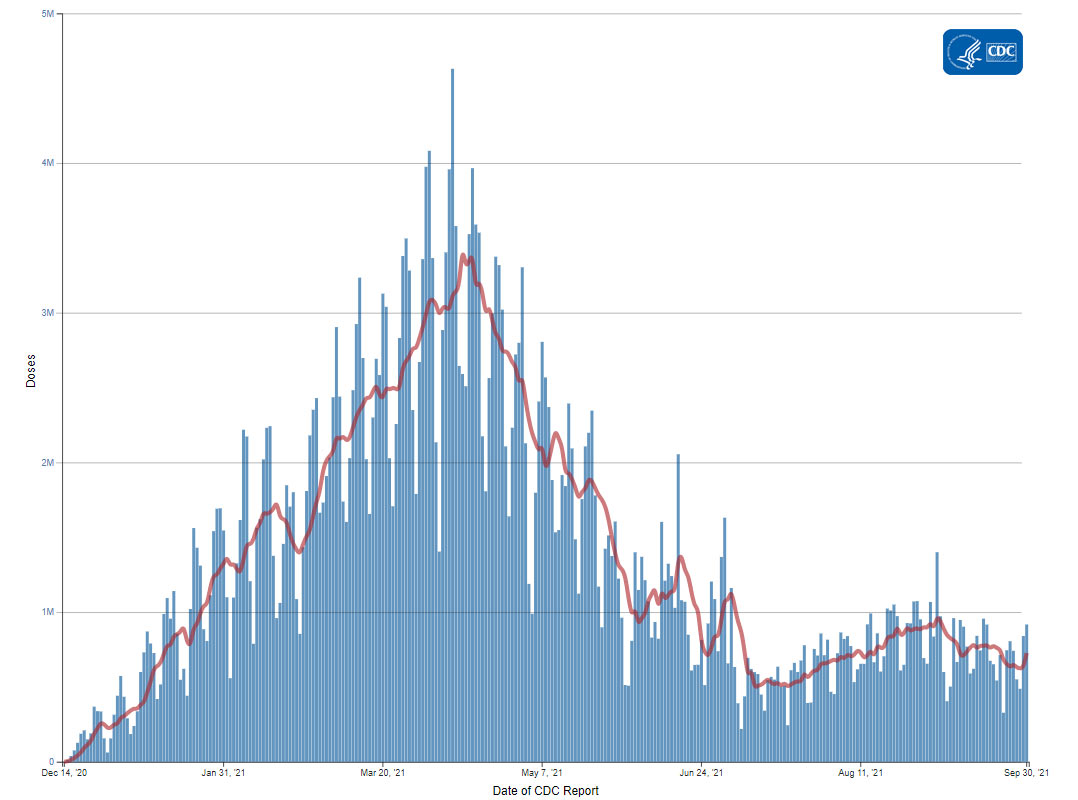
The U.S. COVID-19 Vaccination Program began December 14, 2020. As of September 30, 2021, 392.9 million vaccine doses have been administered. Overall, about 214.3 million people, or 64.6% of the total U.S. population, have received at least one dose of vaccine. About 184.6 million people, or 55.6% of the total U.S. population, have been fully vaccinated.* As of September 30, 2021, the 7-day average number of administered vaccine doses reported (by date of CDC report) to CDC per day was 726,899, a 6.4% increase from the previous week.
CDC’s COVID Data Tracker Vaccination Demographic Trends tab shows vaccination trends by age group. As of September 30, 2021, 93.8% of people ages 65 years or older have received at least one dose of vaccine and 83.3% are fully vaccinated. More than three-quarters (77.3%) of people ages 18 years or older have received at least one dose of vaccine and 66.9% are fully vaccinated. For people ages 12 years or older, 75.5% have received at least one dose of vaccine and 65.1% are fully vaccinated.
392,909,995
Vaccines Administered
392,909,995
Vaccines Administered
214,332,261
People who received at least one dose
214,332,261
People who received at least one dose
184,601,450
People who are fully vaccinated*
184,601,450
People who are fully vaccinated*
64.6%
Percentage of the US population that has received at least one dose
64.6%
Percentage of the US population that has received at least one dose
55.6%
Percentage of the US population that has been fully vaccinated*
55.6%
Percentage of the US population that has been fully vaccinated*
+0.6
Percentage point increase from last week
+0.6
Percentage point increase from last week
+0.6
Percentage point increase from last week
+0.6
Percentage point increase from last week
*Represents the number of people who have received the second dose in a two-dose COVID-19 vaccine series (such as the Pfizer or Moderna vaccines) or one dose of the single-shot Johnson & Johnson’s Janssen vaccine.
Daily Change in the Total Number of Administered COVID-19 Vaccine Doses Reported to CDC by the Date of CDC Report, United States

7-Day moving average
Hospitalizations
New Hospital Admissions
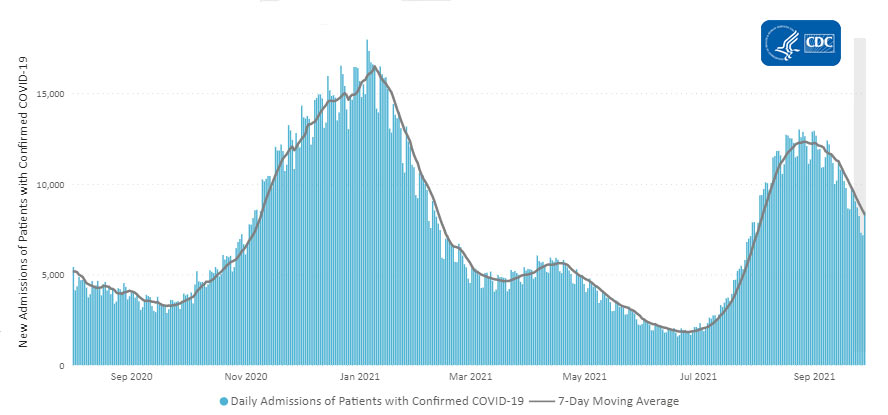
The current 7-day daily average for September 22–September 28, 2021, was 8,321. This is a 14.9% decrease from the prior 7-day average (9,782) from September 15–September 21, 2021.
3,047,033
Total New Admissions
3,047,033
Total New Admissions
8,321
Current 7-Day Average
8,321
Current 7-Day Average
9,782
Prior 7-Day Average
9,782
Prior 7-Day Average
-14.9%
Change in 7-Day Average
-14.9%
Change in 7-Day Average
The start of consistent reporting of hospital admissions data was August 1, 2020.
Daily Trends in Number of New COVID-19 Hospital Admissions in the United States
New admissions are pulled from a 10 am EST snapshot of the HHS Unified Hospital Timeseries Dataset. Due to potential reporting delays, data from the most recent 7 days, as noted in the figure above with the grey bar, should be interpreted with caution. Small shifts in historic data may also occur due to changes in the Centers for Medicare and Medicaid Services (CMS) Provider of Services file, which is used to identify the cohort of included hospitals.
COVID-NET: Trends in Hospitalization Rates in Children Ages 4 Years and Younger Not Eligible for Vaccination
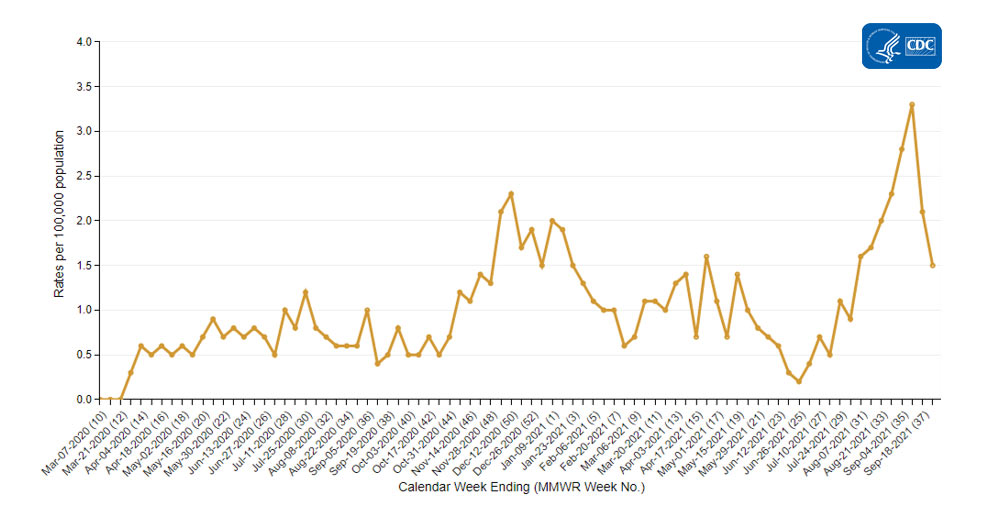
CDC’s Coronavirus Disease 2019-Associated Hospitalization Surveillance Network (COVID-NET) shows that hospitalization rates are still increasing in children. Recent weekly rates of COVID-19-associated hospitalizations for these children have steadily increased since the end of June 2021. For the week ending September 11, 2021, weekly rates of COVID-19-associated hospitalization in children ages 4 years and younger are 3.3 per 100,000. These recent rates are the highest seen for this age group during the pandemic. Unlike adults, children younger than 12 years of age are not yet eligible for any of the available COVID-19 vaccines.
Trends in Hospitalization Rates in Children Ages 4 Years and Younger Not Eligible for Vaccination
The Coronavirus Disease 2019 (COVID-19)-Associated Hospitalization Surveillance Network (COVID-NET) is an additional source for hospitalization data collected through a network of more than 250 acute-care hospitals in 14 states (representing ~10% of the U.S. population). Detailed data on patient demographics, including race/ethnicity, underlying medical conditions, medical interventions, and clinical outcomes, are standardized case reporting form.
Deaths
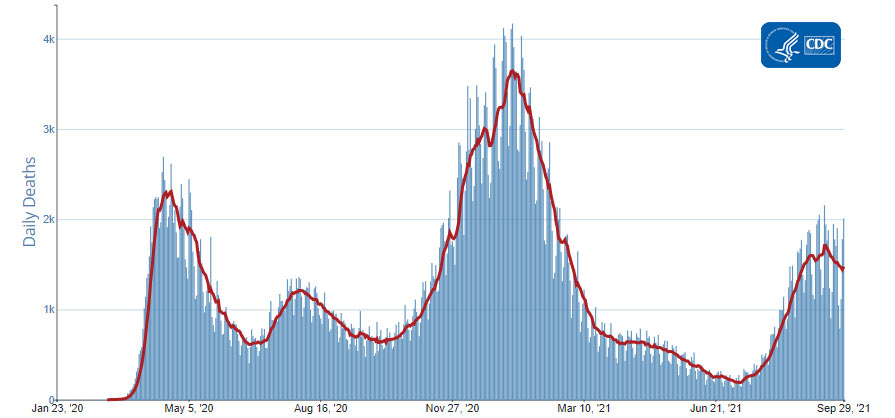
The current 7-day moving average of new deaths (1,476) has decreased 3.3% compared with the previous 7-day moving average (1,527). As of September 29, 2021, a total of 694,701 COVID-19 deaths have been reported in the United States.
694,701
Total Deaths Reported
694,701
Total Deaths Reported
1,476
Current 7-Day Average*
1,476
Current 7-Day Average*
1,527
Prior 7-Day Average
1,527
Prior 7-Day Average
-3.3%
Change in 7-Day Average Since Prior Week
-3.3%
Change in 7-Day Average Since Prior Week
*Historical deaths are excluded from the daily new deaths and 7-day average calculations until they are incorporated into the dataset by their applicable date. Of 8,566 historical deaths reported retroactively, 631 were reported in the current week; and 226 were reported in the prior week.
Daily Trends in Number of COVID-19 Deaths in the United States Reported to CDC

7-Day moving average
- Safety Monitoring of an Additional Dose of COVID-19 Vaccine — United States, August 12–September 19, 2021
- Disparities in COVID-19 Vaccination Status, Intent, and Perceived Access for Noninstitutionalized Adults, by Disability Status — National Immunization Survey Adult COVID Module, United States, May 30–June 26, 2021
Recent COVID Data Tracker Updates
- A new Vaccine Effectiveness tab shows vaccine effectiveness against hospitalizations and infections
- The Vaccinations in the US tab now displays the number and percent of booster doses by certain age groupings (Total, 18+, 50+, and 65+), and the number of people with a booster dose by vaccine type
- The COVID Data Tracker homepage stats bar now shows the percent of the 12+ population with at least one dose of a COVID-19 vaccine
