Recommendations for Fully Vaccinated People
COVID-19 Homepage
A Spooky—and Safe—Halloween
Interpretive Summary for October 14, 2022

A Spooky—and Safe—Halloween
It’s time to pick out your costume and get ready to celebrate Halloween! Over the past two-plus years, we’ve learned new ways to enjoy pandemic holidays, and “outside is always safer” has been the mantra for these holiday gatherings. Luckily, that’s easy to do on Halloween, because trick-or-treating generally involves plenty of outdoor time. But that doesn’t mean it’s totally risk-free. Here are some more tips for staying COVID-safe this Halloween.
- Stay home if you’re sick. Skip the Halloween party if you aren’t feeling well.
- Get tested if you have COVID-19 symptoms.
- Take precautions in crowded or indoor events as informed by your county’s COVID-19 Community Level, like wearing a high-quality mask (and Halloween masks don’t count). Consider making the mask part of the costume—like a doctor, nurse, ninja, or cowboy.
- If you’re hosting celebrations, review options for improving ventilation in your home. This can help you reduce virus particles in your home and keep COVID-19 from spreading.
- Keep your hands clean. If you’re out trick-or-treating, bring hand sanitizer. If you’re giving out candy, wash your hands frequently.
And of course, the best way to protect yourself and others from severe illness from COVID-19 on Halloween (and every day) is to stay up to date on your COVID-19 vaccinations! Use this tool to find out when you can get a booster.
Note to Readers: On October 12, 2022, CDC recommended updated (bivalent) COVID-19 boosters for children ages 5 years and older in the United States, making the updated boosters available to millions of children in this age group.
COVID-19 Community Levels*
As of October 13, 2022, there are 67 (2.1%) counties, districts, or territories with a high COVID-19 Community Level, 583 (18.1%) counties with a medium Community Level, and 2,567 (79.7%) counties with a low Community Level. Compared with last week, this represents a minor decrease (−0.8 percentage points) in the number of high-level counties, a moderate decrease (-2.2 percentage points) in the number of medium-level counties, and a moderate increase (+3.0 percentage points) in the number of low-level counties. Overall, 45 out of 52 jurisdictions** had high- or medium-level counties this week. Arizona, the District of Columbia, Hawaii, Nevada, New Mexico, South Carolina, and Utah are the only jurisdictions to have all counties at low Community Levels.
To check your COVID-19 Community Level, visit COVID Data Tracker. To learn which prevention measures are recommended based on your COVID-19 Community Level, visit COVID-19 Community Level and COVID-19 Prevention.
*CDC recommends use of COVID-19 Community Levels to determine the impact of COVID-19 on communities and to take action. CDC also provides Community Transmission Levels to describe the amount of COVID-19 spread within each county. Healthcare facilities use Community Transmission Levels to determine infection control interventions.
**Includes the 50 states, the District of Columbia, and Puerto Rico.


Reported Cases
As of October 12, 2022, the current 7-day moving average of daily new cases (38,949) decreased 11.9% compared with the previous 7-day moving average (44,233). A total of 96,640,059 COVID-19 cases have been reported in the United States as of October 12, 2022.
Variant Proportions
CDC Nowcast projections* for the week ending October 1, 2022 estimate that the combined national proportion of lineages designated as Omicron will continue to be 100%. There are eight designated as Omicron: BA.5, BA.4.6, BQ.1.1, BQ.1, BF.7, BA2.75.2, BA.2.75, and BA.4. The predominant Omicron lineage is BA.5, projected to be 67.9% (95% PI 64.1-71.4%).
The national proportion of BA.4.6 is projected to be 12.2% (95% PI 11.1-13.4%), BQ.1.1 is projected to be 5.7% (95% PI 3.5-9.1%), BQ.1 is projected to be 5.7% (95% PI 3.5-8.9%), BF.7 is projected to be 5.3% (95% PI 4.6-6.1%), BA.2.75.2 is projected to be 1.4% (95% PI 0.9-2.2%), BA.2.75 is projected to be 1.3% (95% PI 1.0-1.6%), and BA.4 is projected to be 0.6% (95% PI 0.5-0.6%). See COVID Data Tracker for current data.
96,640,059
Total Cases Reported
38,949
Current 7-Day Average**
44,233
Previous 7-Day Average
-11.9%
Change in 7-Day Average since Previous Week
*CDC uses Nowcast projections to predict current variant proportions circulating in the United States. The median time from specimen collection to sequence data reporting is about 3 weeks. As a result, weighted estimates for the most recent few weeks may be unstable or unavailable. View Nowcast estimates on CDC’s COVID Data Tracker website on the Variant Proportions page.
**Historical cases are excluded from daily new cases and 7-day average calculations until they are incorporated into the dataset for the applicable date. Of 670,655 historical cases reported retroactively, none were reported in the current week and none were reported in the prior week.
Daily Trends in COVID-19 Cases in the United States Reported to CDC

7-Day moving average

Vaccinations
COVID-19 Vaccine Primary Series
As of October 12, 2022, 627.9 million vaccine doses have been administered in the United States. Overall, about 265.1 million people, or 79.9% of the total U.S. population, have received at least one dose of vaccine. About 226.2 million people, or 68.1% of the total U.S. population, have completed a primary series.*
627,854,963
Vaccine Doses Administered
265,111,489
People who received at least one dose (79.5% of the U.S. population)
226,200,755
People who are fully vaccinated* (67.9% of the U.S. population)
+0.2
Percentage point change from last week
+0.1
Percentage point change from last week
*Represents the number of people who have received the second dose in a two-dose COVID-19 vaccine series (such as the Pfizer-BioNTech, Moderna, or Novavax vaccines) or one dose of the single-shot Johnson & Johnson’s Janssen vaccine.
Daily Change in the Total Number of Administered COVID-19 Vaccine Doses Reported to CDC by the Date of Administration, United States
7-Day moving average

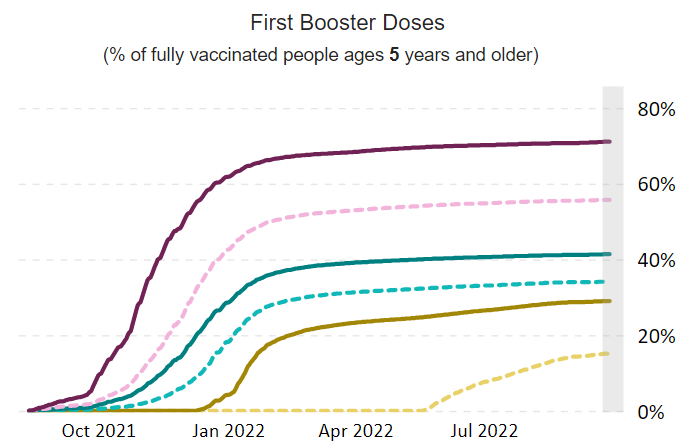
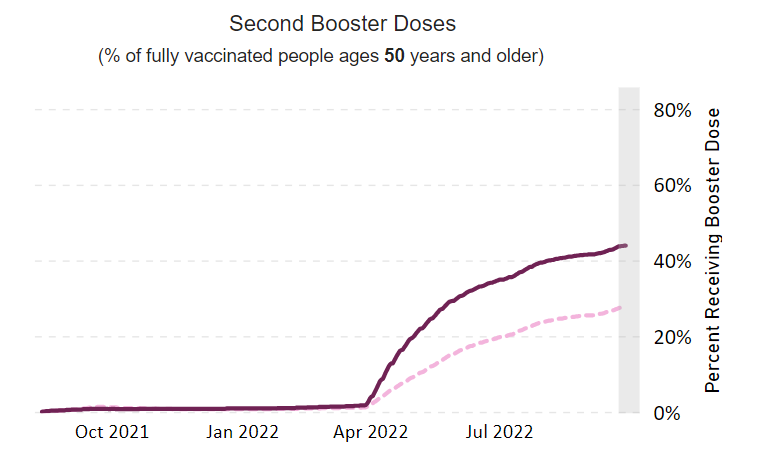
COVID-19 Vaccine Boosters
Of those who have completed a primary series, about 110.8 million people have received a booster dose,* and more than 14.78 million people have received an updated (bivalent) booster dose. But 49.6% of the total booster-eligible population has not yet received a booster dose. Booster dose eligibility varies by age and health condition. Learn more about who is eligible.
140,398,659
Booster Doses Administered
110,831,519
Population ≥ 5 Years of Age with a 1st booster dose*
25,623,483
Population ≥ 50 Years of Age with a 2nd booster dose**
49.1%
Percentage of the Population ≥ 5 Years of Age with a 1st booster dose
39.0%
Percentage of the Population ≥ 50 Years of Age with a 2nd booster dose
+0.0
Percentage point change from last week
+1.1
Percentage point change from last week
*Represents the number of people who have completed a primary series and have received another dose of COVID-19 vaccine since August 13, 2021. This includes people who received their first additional dose or booster dose.
**Represents the number of people who have completed a primary series and have received two subsequent doses of COVID-19 vaccine since August 13, 2021. This includes people who received two booster doses and people who received one additional dose and one booster dose.

5,400,083
Total New Admissions
3,268
Current 7-Day Average
3,419
Prior 7-Day Average
-4.4%
Change in 7-Day Average
The start of consistent reporting of hospital admissions data was August 1, 2020.
Daily Trends in Number of New COVID-19 Hospital Admissions in the United States

New admissions are pulled from a 10 am EDT snapshot of the HHS Unified Hospital Data – Analytic Dataset. Due to potential reporting delays, data from the most recent 7 days, as noted in the figure above with the grey bar, should be interpreted with caution. Small shifts in historic data may also occur due to changes in the Centers for Medicare & Medicaid Services (CMS) Provider of Services file, which is used to identify the cohort of included hospitals.
COVID-NET: Hospitalization Rates among Adults and Children (All Ages)
CDC’s Coronavirus Disease 2019-Associated Hospitalization Surveillance Network (COVID-NET) shows that COVID-19-associated hospitalizations continue to decline. Hospitalization rates among people of all ages declined from a recent peak of 9.6 per 100,000 population for the week ending July 30, 2022 to 6.0 for the week ending September 24, 2022.
Weekly Rates of COVID-19-Associated Hospitalizations among Adults and Children (all ages)
")
The Coronavirus Disease 2019 (COVID-19)-Associated Hospitalization Surveillance Network (COVID-NET) is an additional source for hospitalization data collected through a network of more than 250 acute-care hospitals in 14 states (representing ~10% of the U.S. population). Detailed data on patient demographics, including race/ethnicity, underlying medical conditions, medical interventions, and clinical outcomes, are collected using a standardized case reporting form.
Deaths
The current 7-day moving average of new deaths (328) decreased 8.5% compared with the previous 7-day moving average (359). As of October 12, 2022, a total of 1,058,692 COVID-19 deaths have been reported in the United States.
1,058,692
Total Deaths Reported
328
Current 7-Day Average*
359
Prior 7-Day Average
-8.5%
Change in 7-Day Average Since Prior Week
*Historical deaths are excluded from the daily new deaths and 7-day average calculations until they are incorporated into the dataset by their applicable date. Of 22,299 historical deaths reported retroactively, none were reported in the current week; and 27 were reported in the prior week.
Daily Trends in Number of COVID-19 Deaths in the United States Reported to CDC
7-Day moving average
 More Death Data
Testing
The percentage of COVID-19 NAATs (nucleic acid amplification tests)* that are positive is increasing in comparison to the previous week. The 7-day average of percent positivity from NAATs is now 8.8%. The 7-day average number of tests reported for September 30–October 6, 2022, was 352,558, down 18.6% from 432,888 for the prior 7 days.
967,890,195
Total Tests Reported
352,558
7-Day Average Tests Reported
8.8%
7-Day Average % Positivity
8.3%
Previous 7-Day Average % Positivity
+0.47
Percentage point change in 7-Day Average % Positivity since Prior Week
*Test for SARS-CoV-2, the virus that causes COVID-19
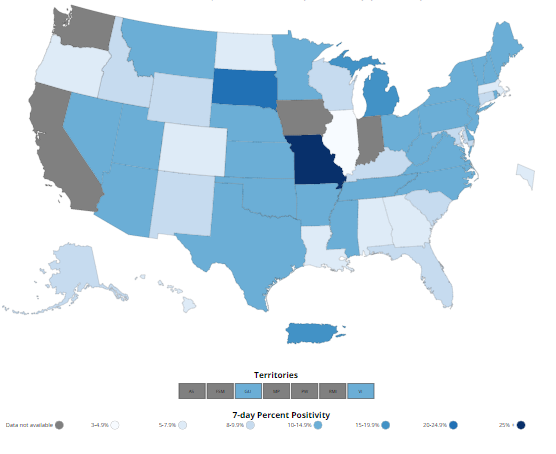
COVID-19 NAAT Laboratory Test 7-day Percent Positivity by State/Territory
Wastewater Surveillance
COVID Data Tracker’s Wastewater Surveillance tab tracks levels, changes, and detections of SARS-CoV-2* viral RNA in wastewater at over 1,250 testing sites across the country.
Currently, about 35% of the country is reporting moderate to high SARS-CoV-2 levels in wastewater. About 16% of sites reporting wastewater data are currently seeing some of the highest levels for those sites since December 1, 2021. About 53% of sites are experiencing a decrease in SARS-CoV-2 levels, and about 41% are reporting an increase. It’s important to note that even a small increase when levels are low can appear like a dramatic increase in the percent change.
For more information on how to use wastewater data, visit CDC’s website.
*The virus that causes COVID-19
SARS-CoV-2 Levels in Wastewater by Site


0% denotes that levels are the lowest they have been at the site; 100% denotes that levels are the highest they have been at the site.