Recommendations for Fully Vaccinated People
COVID-19 Homepage

Healthy Futures
Interpretive Summary for October 15, 2021
Healthy Futures
Fewer cases of COVID-19 have been reported in children (ages 0-17 years) compared with adults.1-3 Rates of COVID-19-associated hospitalizations are also lower in children of all ages compared to adults, but some children develop acute COVID-19 symptoms requiring hospitalization.4 All eligible people, including adolescents ages 12-17 years, should get vaccinated to help stop the pandemic. Everyone in the United States 12 years and older is eligible to receive a COVID-19 vaccine, yet vaccination coverage among adolescents is lower than in older groups.5
Children with underlying medical conditions, including obesity, are at increased risk for severe COVID-19 illness* compared to children without underlying medical conditions. Children diagnosed with obesity may experience worse outcomes from COVID-19.6 A recent CDC study looking at body mass index (BMI) suggests that many children and adolescents gained weight faster during the COVID-19 pandemic than before the pandemic.** This was especially true among children and adolescents who had overweight or obesity before the pandemic.7
In addition to the steps everyone should take to slow the spread of COVID-19, people can help protect themselves and their families by eating a healthy diet, being active, getting enough sleep, and learning to cope with stress in a healthy way. Parents and caregivers can further protect their children by maintaining well-child visits and recommended vaccines, including COVID-19 vaccines for children ages 12 years and older. If you have questions about childhood vaccines, talk with your child’s pediatrician or healthcare provider. To find a vaccine provider near you, visit vaccines.gov or your state or local public health department website.
*Severe illness means that the person with COVID-19 requires hospitalization, intensive care, or a ventilator to help them breathe.
**Body mass index (BMI) is a measurement that takes into account a person’s weight relative to their height. Although children are expected to have increases in BMI as they grow, rapid increases can raise concern over too much weight for health. The rate of BMI change tells us how much BMI changes over a specific time period. This study looked at monthly changes in the rate of BMI at two time periods —before the COVID-19 pandemic (January 2018-February 2020) and during the pandemic (March-November 2020). This study involved a cohort of 432,302 children and adolescents between the ages of 2-19 years.
Note to readers: CDC’s MMWR is excited to announce the release of two new web pages. MMWR’s updated COVID-19 Reports web page features a user-friendly experience, including the latest on COVID-19 vaccine safety and effectiveness, as well as links to MMWR’s Featured Report, MMWR podcasts, and MMWR graphics pages. And MMWR’s COVID-19 Graphics web page allows you to find all of MMWR’s COVID-19 graphics housed in one location. You can also click the report link under each image to read the full MMWR report.
Reported Cases
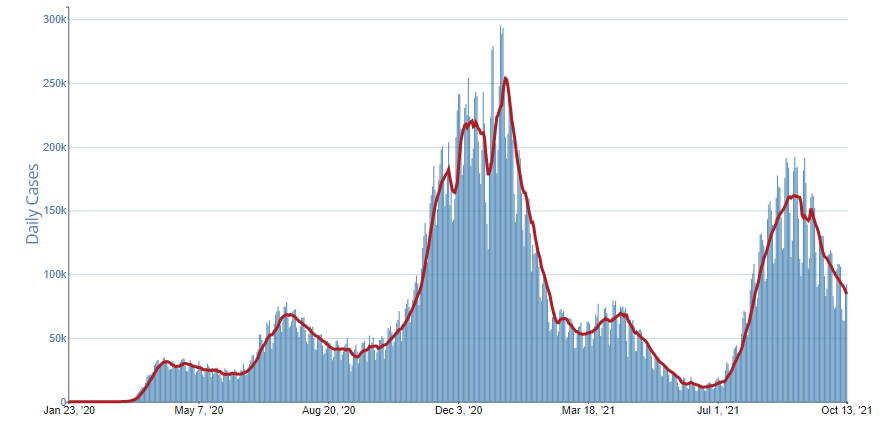
The current 7-day moving average of daily new cases (84,555) decreased 12.5% compared with the previous 7-day moving average (96,666). A total of 44,615,528 COVID-19 cases have been reported as of October 13, 2021.
44,615,528
Total Cases Reported
44,615,528
Total Cases Reported
84,555
Current 7-Day Average*
84,555
Current 7-Day Average*
96,666
Prior 7-Day Average
96,666
Prior 7-Day Average
-12.5%
Change in 7-Day Average since Prior Week
-12.5%
Change in 7-Day Average since Prior Week
*Historical cases are excluded from daily new cases and 7-day average calculations until they are incorporated into the dataset for the applicable date. Of 124,485 historical cases reported retroactively, 3,611 were reported in the current week and 14,358 were reported in the prior week.
Daily Trends in COVID-19 Cases in the United States Reported to CDC

7-Day moving average
SARS-CoV-2 Variants
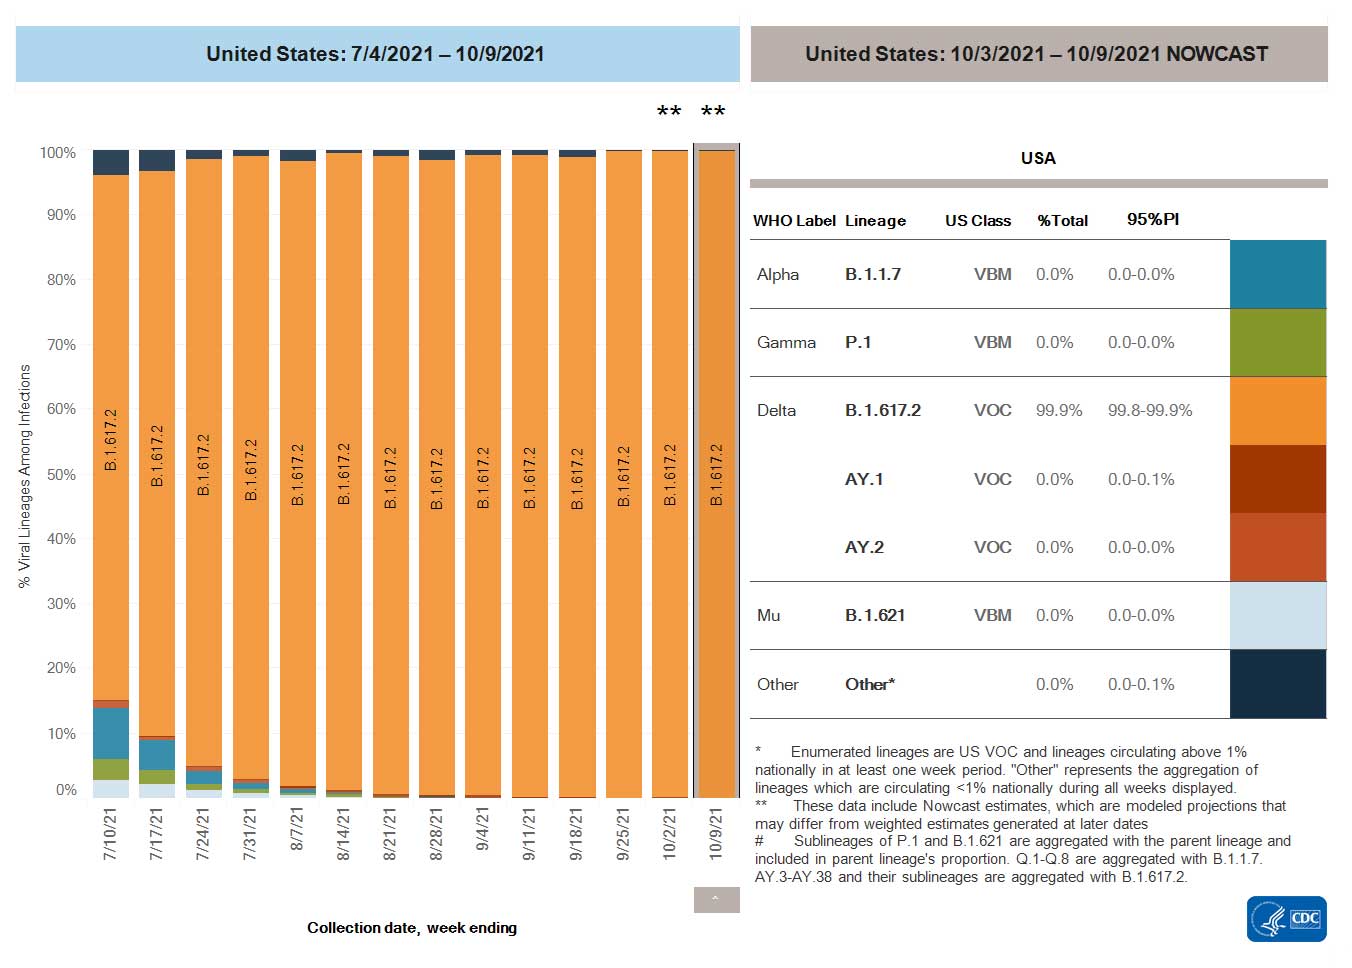
Currently, the Delta variant is the only variant classified as a Variant of Concern (VOC) in the United States. There are no variants classified as a Variant of Interest (VOI) and there are ten variants classified as Variants Being Monitored (VBM). VBM do not pose a significant and imminent risk to public health in the United States due to their very low prevalence, which is currently estimated to be less than 0.1%.
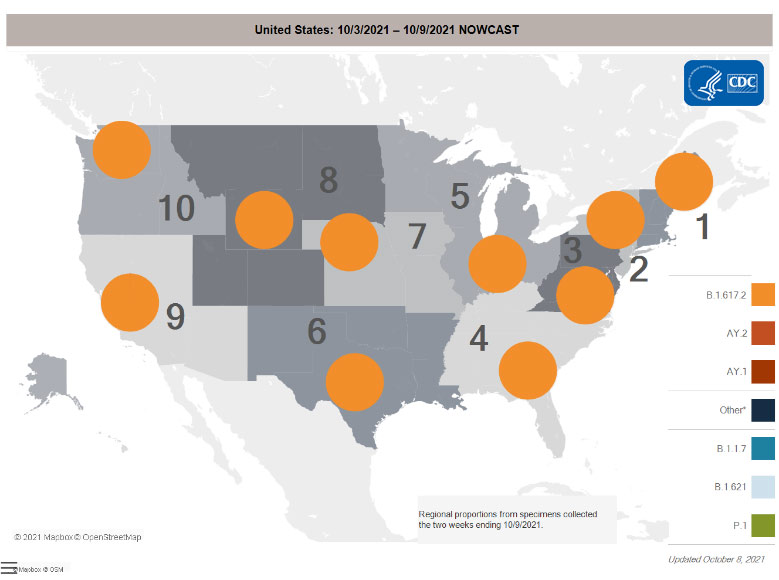
Nowcast projections* for the week ending October 9, 2021, estimate the national proportion of the Delta variant to be greater than 99%. Nowcast estimates indicate that Delta will continue to be the predominant variant circulating in all 10 U.S. Department of Health and Human Services (HHS) regions, circulating at greater than 99%.
*The median time from specimen collection to sequence data reporting is about 3 weeks. As a result, weighted estimates for the most recent few weeks may be unstable or unavailable. CDC’s Nowcast is a data projection tool that helps fill this gap by generating timely estimates of variant proportions for variants that are circulating in the United States. View Nowcast estimates on CDC’s COVID Data Tracker website on the Variant Proportions page.
Testing
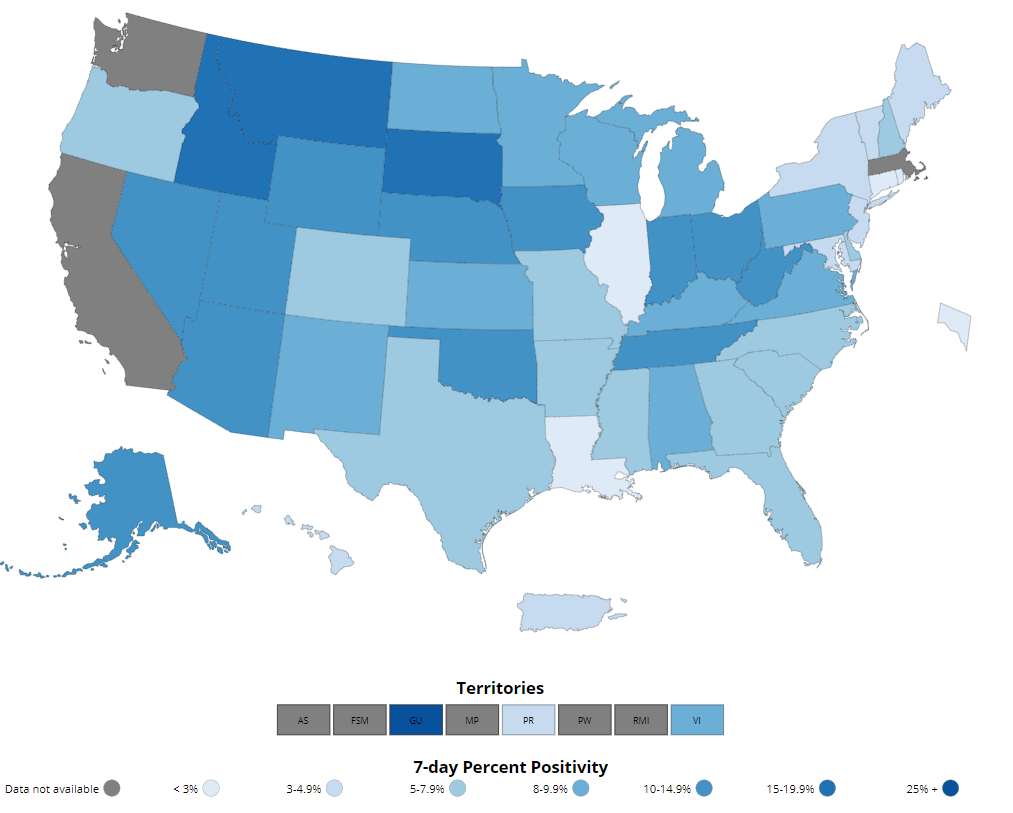
The percentage of COVID-19 NAATs (nucleic acid amplification tests)* that are positive (percent positivityExternal) has decreased from the previous week. The 7-day average of percent positivity from NAATs is now 5.7%. The 7-day average number of tests reported for October 1 – October 7, 2021, was 1,488,436, down 5.4% from 1,573,011 for the prior 7 days.
597,258,741
Total Tests Reported
597,258,741
Total Tests Reported
1,488,436
7-Day Average Tests Reported
1,488,436
7-Day Average Tests Reported
5.7%
7-Day Average % Positivity
5.7%
7-Day Average % Positivity
6.0%
Previous 7-Day Average % Positivity
6.0%
Previous 7-Day Average % Positivity
-4.1%
Change in 7-Day Average % Positivity since Prior Week
-4.1%
Change in 7-Day Average % Positivity since Prior Week
*Test for SARS-CoV-2, the virus that causes COVID-19
COVID-19 NAAT Laboratory Test 7-day Percent Positivity by State/Territory
Vaccinations
The U.S. COVID-19 Vaccination Program began December 14, 2020. As of October 14, 2021, 405.4 million vaccine doses have been administered. Overall, about 218 million people, or 65.6% of the total U.S. population, have received at least one dose of vaccine. About 188.3 million people, or 56.7% of the total U.S. population, have been fully vaccinated.* About 9.3 million additional/booster doses in fully vaccinated people have been reported. As of October 14, 2021, the 7-day average number of administered vaccine doses reported (by date of CDC report) to CDC per day was 841,731, a 11.3% decrease from the previous week.
CDC’s COVID Data Tracker Vaccination Demographic Trends tab shows vaccination trends by age group. As of October 14, 2021, 95.4% of people ages 65 years or older have received at least one dose of vaccine and 84.2% are fully vaccinated. More than three-quarters (78.6%) of people ages 18 years or older have received at least one dose of vaccine and 68.1% are fully vaccinated. For people ages 12 years or older, 76.8% have received at least one dose of vaccine and 66.4% are fully vaccinated.
405,444,558
Vaccines Administered
405,444,558
Vaccines Administered
217,953,275
People who received at least one dose
217,953,275
People who received at least one dose
188,281,747
People who are fully vaccinated*
188,281,747
People who are fully vaccinated*
65.6%
Percentage of the US population that has received at least one dose
65.6%
Percentage of the US population that has received at least one dose
56.7%
Percentage of the US population that has been fully vaccinated*
56.7%
Percentage of the US population that has been fully vaccinated*
+0.5
Percentage point increase from last week
+0.5
Percentage point increase from last week
+0.5
Percentage point increase from last week
+0.5
Percentage point increase from last week
*Represents the number of people who have received the second dose in a two-dose COVID-19 vaccine series (such as the Pfizer or Moderna vaccines) or one dose of the single-shot Johnson & Johnson’s Janssen vaccine.
Daily Change in the Total Number of Administered COVID-19 Vaccine Doses Reported to CDC by the Date of CDC Report, United States

7-Day moving average
Hospitalizations
New Hospital Admissions
The current 7-day daily average for October 6–October 12, 2021, was 6,659. This is an 8.8% decrease from the prior 7-day average (7,303) from September 29–October 5, 2021.
3,143,513
Total New Admissions
3,143,513
Total New Admissions
6,659
Current 7-Day Average
6,659
Current 7-Day Average
7,303
Prior 7-Day Average
7,303
Prior 7-Day Average
-8.8%
Change in 7-Day Average
-8.8%
Change in 7-Day Average
The start of consistent reporting of hospital admissions data was August 1, 2020.
Daily Trends in Number of New COVID-19 Hospital Admissions in the United States
New admissions are pulled from a 10 am EST snapshot of the HHS Unified Hospital Timeseries Dataset. Due to potential reporting delays, data from the most recent 7 days, as noted in the figure above with the grey bar, should be interpreted with caution. Small shifts in historic data may also occur due to changes in the Centers for Medicare and Medicaid Services (CMS) Provider of Services file, which is used to identify the cohort of included hospitals.
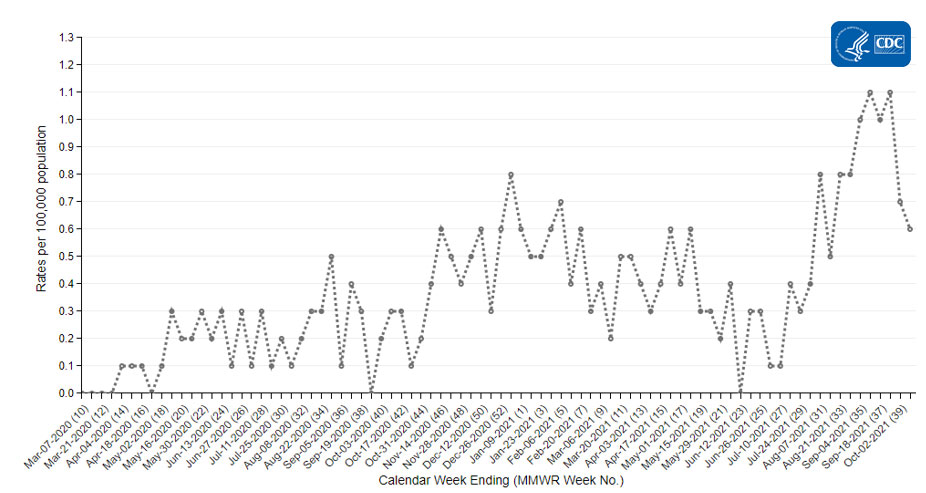
COVID-NET: Trends in Hospitalization Rates in Children Ages 5–11 Years Not Eligible for Vaccination
CDC’s Coronavirus Disease 2019-Associated Hospitalization Surveillance Network (COVID-NET) shows that rates of COVID-19-associated hospitalizations remain elevated in children ages 5–11 years and younger. Recent weekly rates of COVID-19-associated hospitalizations for these children are the highest they have ever been. Rates in children ages 5–11 years are 1.1 per 100,000 for the week ending September 25, 2021. Children 12 years and younger are not yet eligible for any of the available COVID-19 vaccines.
Trends in Hospitalization Rates in Children Ages 5–11 Years Not Eligible for Vaccination
The Coronavirus Disease 2019 (COVID-19)-Associated Hospitalization Surveillance Network (COVID-NET) is an additional source for hospitalization data collected through a network of more than 250 acute-care hospitals in 14 states (representing ~10% of the U.S. population). Detailed data on patient demographics, including race/ethnicity, underlying medical conditions, medical interventions, and clinical outcomes, are standardized case reporting form.
Deaths
The current 7-day moving average of new deaths (1,241) has decreased 13.4% compared with the previous 7-day moving average (1,434). As of October 13, 2021, a total of 718,681 COVID-19 deaths have been reported in the United States.
718,681
Total Deaths Reported
718,681
Total Deaths Reported
1,241
Current 7-Day Average*
1,241
Current 7-Day Average*
1,434
Prior 7-Day Average
1,434
Prior 7-Day Average
-13.4%
Change in 7-Day Average Since Prior Week
-13.4%
Change in 7-Day Average Since Prior Week
*Historical deaths are excluded from the daily new deaths and 7-day average calculations until they are incorporated into the dataset by their applicable date. Of 9,266 historical deaths reported retroactively, 469 were reported in the current week; and 220 were reported in the prior week.
Daily Trends in Number of COVID-19 Deaths in the United States Reported to CDC

7-Day moving average
- CDC. COVID Data Tracker: Demographic Trends of COVID-19 cases and deaths in the US reported to CDC. Atlanta, GA: US Department of Health and Human Services, CDC; 2021. https://covid.cdc.gov/covid-data-tracker/#demographics.
- Stokes EK, Zambrano LD, Anderson KN, et al. Coronavirus Disease 2019 Case Surveillance – United States, January 22-May 30, 2020. MMWR. 2020;69:759-765. doi:10.15585/mmwr.mm6924e2.
- Williams N, Radia T, Harman K, et al. COVID-19 Severe Acute Respiratory Syndrome Coronavirus 2 (SARS-CoV-2) Infection in Children and Adolescents: A Systematic Review of Critically Unwell Children and the Association With Underlying Comorbidities. Eur J Pediatr. 2020;10:1-9.doi:10.1007/s00431-020-03801-6External
- Kim L, Whitaker M, O’Halloran A, et al. Hospitalization Rates with Characteristics of Children Aged <18 Years Hospitalized with Laboratory-Confirmed COVID-19 ― COVID-Net, 14 States, March 1-July 25, 2020. MMWR Morb Mortal Wkly Rep 2020;69:1081 – 1099. doi: http://dx.doi.org/10.15585/mmwr.mm6932e
- CDC. COVID Data Tracker: Percent of People Receiving COVID-19 Vaccine by Age and Date Reported to CDC, United States. Atlanta, GA: US Department of Health and Human Services, CDC; 2021. https://covid.cdc.gov/covid-data-tracker/#vaccination-demographics-trends.
- Kompaniyets L, Agathis NT, Nelson JM, et al. Underlying Medical Conditions Associated With Severe COVID-19 Illness Among Children. JAMA Netw Open. 2021;4(6):e2111182.doi:10.1001/jamanetworkopen.2021.11182External
- Lange SJ, Kompaniyets L, Freedman DS, et al. Longitudinal Trends in Body Mass Index Before and During the COVID-19 Pandemic Among Persons Aged 2-19 Years ― United States, 2018-2020. MMWR Morb Mortal Wkly rep 2021;70:1278-1283. doi: http://dx.doi.org/10.15585/mmwr.mm7037a3
- Distribution of SARS-CoV-2 Variants in a Large Integrated Health Care System — California, March–July 2021
- Multicomponent Strategies to Prevent SARS-CoV-2 Transmission — Nine Overnight Youth Summer Camps, United States, June–August 2021
- COVID-19 Outbreaks at Youth Summer Camps — Louisiana, June–July 2021
- National and State Trends in Anxiety and Depression Severity Scores Among Adults During the COVID-19 Pandemic — United States, 2020–2021
Recent COVID Data Tracker Updates
- New Hospitalizations by Vaccination Status – COVID-NET tab shows hospitalization rates by vaccination status
- New Rates of Cases and Deaths by Vaccination Status tab shows infection and death rates by vaccination status
