Recommendations for Fully Vaccinated People
COVID-19 Homepage
Monitoring Variants
Interpretive Summary for October 21, 2022

Monitoring Variants
Viruses constantly change through mutation, and sometimes these mutations result in new variants of the virus. Numerous variants of SARS-CoV-2, the virus that causes COVID-19, have been tracked in the United States and globally during this pandemic. The Omicron variant, like other variants, is made up of a number of lineages and sublineages. These lineages are often very similar to each other, but there can be differences that affect the behavior of the virus.
CDC is closely tracking a wide range of Omicron sublineages, including three drawing recent attention. BQ.1 and BQ.1.1 are offshoots—grandchildren, if you will—of the BA.5 that’s been dominant for months. CDC data show that they seem to be spreading relatively quickly so far, but they’re still a small proportion of overall variants. CDC is also keeping a close eye on a sublineage called XBB based on international reports, although it’s still very rare in the United States.
Sometimes new variants emerge and disappear. Other times, they persist and continue to circulate in communities. As the virus spreads, it has new opportunities to change in ways that can make emerging variants more difficult to stop because the effectiveness of vaccinations or treatments may be reduced. We can monitor mutations from one variant to another and monitor the impact of these changes by comparing differences in real-world characteristics, such as effectiveness of vaccines or treatments. By studying each variant and understanding these differences, scientists can monitor whether a new variant might be more dangerous.
CDC is using multiple surveillance systems to monitor variants in the United States. Data from each system plays an important role in helping us understand the emergence of new variants, whether they’re entering the United States and spreading, and which variants are most prevalent within communities. On October 20, 2022, COVID Data Tracker added a new Variant Summary page, which summarizes three systems that are being used to monitor variants. For more information on these systems, see A Closer Look.
- COVID Data Tracker added a new Variant Summary page within the Variant and Genomic Surveillance data grouping. This page summarizes three systems that are being used to monitor variants: the National SARS-CoV-2 Strain Surveillance (NS3) programExternal, CDC’s National Wastewater Surveillance System, and CDC’s Traveler-based SARS-CoV-2 Genomic Surveillance Program.
- COVID Data Tracker added a new Traveler-Based SARS-CoV2-Genomic Surveillance page that reports data from the CDC Traveler-Based SARS-CoV-2 Program. These data represent SARS-CoV-2 test positivity and variants identified among volunteer travelers arriving from more than 25 countries at four major U.S. international airports.
- COVID Data Tracker’s Trends in Number of COVID-19 Cases and Deaths in the US Reported to CDC, by State/Territory page will now be updated to display all metrics at the weekly level, rather than daily.
- Influenza and COVID-19 Vaccination Coverage Among Health Care Personnel — United States, 2021–22
- Effectiveness of Monovalent mRNA Vaccines Against COVID-19–Associated Hospitalization Among Immunocompetent Adults During BA.1/BA.2 and BA.4/BA.5 Predominant Periods of SARS-CoV-2 Omicron Variant in the United States — IVY Network, 18 States, December 26, 2021–August 31, 2022
- Effectiveness of COVID-19 mRNA Vaccines Against COVID-19–Associated Hospitalizations Among Immunocompromised Adults During SARS-CoV-2 Omicron Predominance — VISION Network, 10 States, December 2021— August 2022
COVID-19 Community Levels*
As of October 20, 2022, there are 46 (1.4%) counties, districts, or territories with a high COVID-19 Community Level, 565 (17.6%) counties with a medium Community Level, and 2,606 (80.9%) counties with a low Community Level. Compared with last week, this represents a minor decrease (−0.7 percentage points) in the number of high-level counties, a minor decrease (-0.6 percentage points) in the number of medium-level counties, and a minor increase (+1.2 percentage points) in the number of low-level counties. Overall, 44 out of 52 jurisdictions** had high- or medium-level counties this week. Alaska, the District of Columbia, Hawaii, Mississippi, Nevada, South Carolina, Utah, and Washington are the only jurisdictions to have all counties at low Community Levels.
To check your COVID-19 Community Level, visit COVID Data Tracker. To learn which prevention measures are recommended based on your COVID-19 Community Level, visit COVID-19 Community Level and COVID-19 Prevention.
*CDC recommends use of COVID-19 Community Levels to determine the impact of COVID-19 on communities and to take action. CDC also provides Community Transmission Levels to describe the amount of COVID-19 spread within each county. Healthcare facilities use Community Transmission Levels to determine infection control interventions.
**Includes the 50 states, the District of Columbia, and Puerto Rico.


Reported Cases
As of October 19, 2022, the current 21-day average of weekly new cases (39,803) decreased 30.9% compared with the previous 21-day moving average (57,564). A total of 97,063,357 COVID-19 cases have been reported in the United States as of October 19, 2022.
Variant Proportions
CDC Nowcast projections* for the week ending October 22, 2022, estimate that the combined national proportion of lineages designated as Omicron will continue to be 100%. There are eight sublineages designated as Omicron: BA.5, BA.4.6, BQ.1, BQ.1.1, BF.7, BA.2.75, BA.2.75.2 and BA.4. The predominant Omicron lineage is BA.5, projected to be 62.2% (95% PI 57.8-66.3%).
The national proportion of BA.4.6 is projected to be 11.3% (95% PI 10.2-12.6%), BQ.1 is projected to be 9.4% (95% PI 6.7-12.9%), BQ.1.1 is projected to be 7.2% (95% PI 4.8-10.4%), BF.7 is projected to be 6.7% (95% PI 5.8-7.6%), BA.2.75 is projected to be 1.6% (95% PI 1.3-1.9%), BA.2.75.2 is projected to be 1.3% (95% PI 0.9-1.9%), and BA.4 is projected to be 0.4% (95% PI 0.3-0.4%). See COVID Data Tracker for current data.
97,063,357
Total Cases Reported
39,803
Current 21-Day Average**
57,564
Previous 21-Day Average
-30.9%
Change in 21-Day Average since Previous Week
*CDC uses Nowcast projections to predict current variant proportions circulating in the United States. The median time from specimen collection to sequence data reporting is about 3 weeks. As a result, weighted estimates for the most recent few weeks may be unstable or unavailable. View Nowcast estimates on CDC’s COVID Data Tracker website on the Variant Proportions page.
**Historical cases are excluded from daily new cases and 7-day average calculations until they are incorporated into the dataset for the applicable date. Of 670,655 historical cases reported retroactively, 11,753 were reported in the current week and none were reported in the prior week.
Daily Trends in COVID-19 Cases in the United States Reported to CDC

Vaccinations
COVID-19 Vaccine Primary Series
As of October 20, 2022, 632.9 million vaccine doses have been administered in the United States. Overall, about 265.6 million people, or 80% of the total U.S. population, have received at least one dose of vaccine. About 226.6 million people, or 68.2% of the total U.S. population, have completed a primary series.*
632,905,664
Vaccine Doses Administered
265,591,330
People who received at least one dose (80.0% of the U.S. population)
226,594,560
People who are fully vaccinated* (68.2% of the U.S. population)
+0.5
Percentage point change from last week
+0.3
Percentage point change from last week
*Represents the number of people who have received the second dose in a two-dose COVID-19 vaccine series (such as the Pfizer-BioNTech, Moderna, or Novavax vaccines) or one dose of the single-shot Johnson & Johnson’s Janssen vaccine.
Daily Change in the Total Number of Administered COVID-19 Vaccine Doses Reported to CDC by the Date of Administration, United States

7-Day moving average

COVID-19 Vaccine Boosters
Of those who have completed a primary series, about 111.4 million people have received a booster dose*, and more than 19.35 million people have received an updated (bivalent) booster dose. But 49.5% of the total booster-eligible population has not yet received a booster dose. Booster dose eligibility varies by age and health condition. Learn more about who is eligible.
142,897,463
Booster Doses Administered
111,363,104
Population ≥ 5 Years of Age with a 1st booster dose*
26,796,838
Population ≥ 50 Years of Age with a 2nd booster dose**
49.3%
Percentage of the Population ≥ 5 Years of Age with a 1st booster dose
40.6%
Percentage of the Population ≥ 50 Years of Age with a 2nd booster dose
+0.4
Percentage point change from last week
+4.0
Percentage point change from last week
*Represents the number of people who have completed a primary series and have received another dose of COVID-19 vaccine since August 13, 2021. This includes people who received their first additional dose or booster dose.
**Represents the number of people who have completed a primary series and have received two subsequent doses of COVID-19 vaccine since August 13, 2021. This includes people who received two booster doses and people who received one additional dose and one booster dose.
COVID-19 Booster Dose Administration, United States


5,422,246
Total New Admissions
3,156
Current 7-Day Average
3,301
Prior 7-Day Average
-4.4%
Change in 7-Day Average
The start of consistent reporting of hospital admissions data was August 1, 2020.
Daily Trends in Number of New COVID-19 Hospital Admissions in the United States

New admissions are pulled from a 10 am EDT snapshot of the HHS Unified Hospital Data – Analytic Dataset. Due to potential reporting delays, data from the most recent 7 days, as noted in the figure above with the grey bar, should be interpreted with caution. Small shifts in historic data may also occur due to changes in the Centers for Medicare & Medicaid Services (CMS) Provider of Services file, which is used to identify the cohort of included hospitals.
COVID-NET: Hospitalization Rates among Adults and Children (All Ages)
CDC’s Coronavirus Disease 2019-Associated Hospitalization Surveillance Network (COVID-NET) shows that COVID-19-associated hospitalizations continue to decline. Hospitalization rates among people of all ages declined from a recent peak of 9.6 per 100,000 population for the week ending July 30, 2022, to 5.5 per 100,000 population for the week ending October 1, 2022.
Weekly Rates of COVID-19-Associated Hospitalizations among Adults and Children (All Ages)
 10/8/22")
The Coronavirus Disease 2019 (COVID-19)-Associated Hospitalization Surveillance Network (COVID-NET) is an additional source for hospitalization data collected through a network of more than 250 acute-care hospitals in 14 states (representing ~10% of the U.S. population). Detailed data on patient demographics, including race/ethnicity, underlying medical conditions, medical interventions, and clinical outcomes, are collected using a standardized case reporting form.
Deaths
The current 21-day moving average of new deaths (388) decreased 13.0% compared with the previous 21-day moving average (446). As of October 19, 2022, a total of 1,065,152 COVID-19 deaths have been reported in the United States.
1,065,152
Total Deaths Reported
388
Current 21-Day Average*
446
Prior 21-Day Average
-13.0%
Change in 21-Day Average Since Prior Week
*Historical deaths are excluded from the daily new deaths and 7-day average calculations until they are incorporated into the dataset by their applicable date. Of 22 historical deaths reported retroactively, none were reported in the current week; and were reported in the prior week.

Testing
The percentage of COVID-19 NAATs (nucleic acid amplification tests)* that are positive is increasing in comparison to the previous week. The 7-day average of percent positivity from NAATs is now 8.7%. The 7-day average number of tests reported for October 7–13, 2022, was 339,441, down 16.4% from 406,263 for the prior 7 days.
970,743,174
Total Tests Reported
339,441
7-Day Average Tests Reported
8.7%
7-Day Average % Positivity
8.1%
Previous 7-Day Average % Positivity
+0.56
Percentage point change in 7-Day Average % Positivity since Prior Week
*Test for SARS-CoV-2, the virus that causes COVID-19
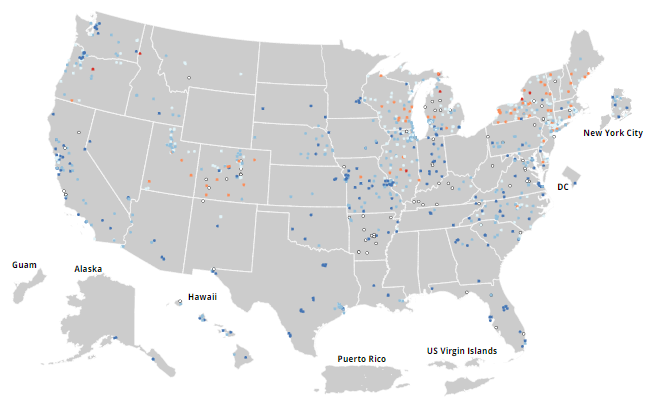
COVID-19 NAAT Laboratory Test 7-day Percent Positivity by State/Territory

Wastewater Surveillance
COVID Data Tracker’s Wastewater Surveillance tab tracks levels, changes, and detections of SARS-CoV-2* viral RNA in wastewater at over 1,250 testing sites across the country.
Currently, about 34% of the country is reporting moderate to high SARS-CoV-2 levels in wastewater. About 9% of sites reporting wastewater data are currently seeing some of the highest levels for those sites since December 1, 2021. About 42% of sites are experiencing a decrease in SARS-CoV-2 levels, and about 51% are reporting an increase.
For more information on how to use wastewater data, visit CDC’s wastewater surveillance website.
*The virus that causes COVID-19
SARS-CoV-2 Levels in Wastewater by Site

0% denotes that levels are the lowest they have been at the site; 100% denotes that levels are the highest they have been at the site.
A Closer Look
A Closer Look Section presents more detailed information for readers who want to learn more about current issues of interest.
Understanding COVID-19 Genomic Surveillance Systems
CDC is using multiple surveillance systems to monitor variants in the United States. Data from each system plays an important role in helping us effectively understand the emergence of new variants, whether variants are entering and spreading in the United States, and which variants are most prevalent within communities in the United States.
On October 20, 2022, COVID Data Tracker added a new Variant Summary page within the Variant and Genomic Surveillance data grouping. This page summarizes three systems that are being used to monitor variants. These systems also have dedicated pages on COVID Data Tracker:
- CDC’s national genomic surveillance system collects SARS-CoV-2 respiratory specimens for sequencing through the National SARS-CoV-2 Strain Surveillance (NS3) ProgramExternal, as well as SARS-CoV-2 sequences generated by commercial laboratories contracted by CDC, state and local public health laboratories, and academic laboratories. Viral genetic sequences are analyzed and classified as a particular variant. The thousands of sequences analyzed every week through CDC’s national genomic sequencing and bioinformatics efforts fuel the comprehensive and population-based U.S. surveillance system established to identify and monitor the spread of variants.
- The National Wastewater Surveillance System (NWSS) works with health departments, laboratories, and wastewater utilities to provide information on SARS-CoV-2 wastewater concentration levels in sewersheds of participating communities. CDC has worked closely with these partners as wastewater surveillance has been adopted by many communities across the nation, and as CDC has developed wastewater surveillance guidance and a centralized reporting system. The NWSS data system provides near real-time, consistent data analysis and results reporting that health departments can use to support their COVID-19 response. Wastewater surveillance can be a critical early warning for authorities of new outbreaks and inform local decision-making, such as where to have mobile testing and vaccination sites.
- Travelers are an especially important group to consider when tracking new and emerging infectious diseases. Travelers move from place to place quickly and can get and spread infectious diseases. The Traveler-based SARS-CoV-2 Genomic Surveillance Program collects clinical specimens voluntarily provided by travelers arriving at several major international airports in the United States for early detection of variants entering the country and to fill gaps in global surveillance.