Recommendations for Fully Vaccinated People
COVID-19 Homepage
Improving COVID-19 Vaccine Equity
Interpretive Summary for October 28, 2022

Improving COVID-19 Vaccine Equity
In September 2022, CDC recommended updated (bivalent)* COVID-19 boosters. Everyone in the United States ages 5 years and older—including those who are moderately or severely immunocompromised—is recommended to receive one dose of the updated booster if it’s been at least two months since their last dose (either the final primary series dose or an original (monovalent)* booster). Nearly 23 million people ages 5 years and older in the United States have received an updated booster as of October 28, 2022.
COVID Data Tracker has started a series of data releases that include information on updated booster dose administration and uptake in the United States. On October 28, new survey results were added to the Trends in COVID-19 Vaccine Confidence in the US tab. The results show that, among survey participants who have completed a primary series, 15.3% reported having received the updated booster, 32.2% definitely plan to get it, 33.0% probably will or are unsure, and 19.5% probably or definitely will not get it. Updated booster uptake among those that completed a primary series was highest among White, non-Hispanic survey participants (19.1%), and lower among American Indian and Alaska Native (non-Hispanic) (7.1%), Black (non-Hispanic) (7.4%), and Hispanic or Latino (10.5%) survey participants., and survey participants of multiple races (6.7%).
A snapshot of updated booster dose administration data was also added to CDC’s website. These data show that updated booster intake is highest among adults ages 65 years and older (20%), and lowest among children ages 5 to 17 years (0-2%). Uptake is also highest among non-Hispanic Asian (8%), non-Hispanic multiracial (8%), and non-Hispanic White (8%) people, and lowest among non-Hispanic Black people (3%) and Hispanic or Latino (3%) people. COVID Data Tracker will continue to add updated booster dose administration data to all vaccination sites, including the addition of demographic trend data.
Is it time for a booster?
Use this tool to determine when or if you (or your child) can get an updated (bivalent) COVID-19 booster.
COVID-19 treatments and vaccines, including the updated booster, provide defenses against the most severe outcomes of COVID-19. Yet challenges remain in ensuring all people have fair and just access to COVID-19 vaccination. CDC is paving the way in vaccine equity efforts with national, state, tribal, territorial, local, and community partners to ensure that people from racial and ethnic minority groups have fair and just access to COVID-19 vaccination. For more information, visit COVID-19 Vaccine Equity for Racial and Ethnic Minority Groups.
* The updated (bivalent) boosters are called “bivalent” because they protect against both the original virus that causes COVID-19 and the Omicron variants BA.4 and BA.5. Monovalent boosters protect only against the original COVID-19 strain.
- On the COVID Data Tracker Vaccinations in the US tab, 1st booster dose and 2nd booster dose metrics were replaced with updated (bivalent) booster dose metrics at the national and jurisdictional levels. Counts and percentages for the populations ages 5+, 12+, 18+, and 65+ years with an updated (bivalent) booster dose are displayed in the national metric box and jurisdictional map views.
- The Vaccination metric in the “Daily Update for the United States” section on the COVID Data Tracker landing page was updated to reflect the count and percent of people ages 5 years and older with an updated (bivalent) booster dose.
- Weekly data on vaccinations and hospitalizations were added back to COVID Data Tracker’s Trends in Number of COVID-19 Cases and Deaths in the US Reported to CDC, by State/Territory tab.
- New indicators were added to COVID Data Tracker’s Trends in COVID-19 Vaccine Confidence in the US and COVID-19 Vaccination Coverage and Vaccine Confidence Among Adults. These new indicators include updated (bivalent) booster uptake and intent to receive updated (bivalent) booster, and an up-to-date measure, based on results from the National Immunization Survey – Adult COVID Module (NIS-ACM).
- Racial and Ethnic Disparities in Outpatient Treatment of COVID-19 — United States, January–July 2022
- Notes From the Field: Dispensing of Oral Antiviral Drugs for Treatment of COVID-19 by Zip Code–Level Social Vulnerability — United States, December 23, 2021–August 28, 2022
COVID-19 Community Levels*
As of October 27, 2022, there are 73 (2.3%) counties, districts, or territories with a high COVID-19 Community Level, 705 (21.9%) counties with a medium Community Level, and 2,439 (75.8%) counties with a low Community Level. Compared with last week, this represents a minor increase (+0.8 percentage points) in the number of high-level counties, a minor increase (+4.4 percentage points) in the number of medium-level counties, and a minor decrease (-5.2 percentage points) in the number of low-level counties. Overall, 46 out of 52 jurisdictions** had high- or medium-level counties this week. California, Delaware, the District of Columbia, Hawaii, North Carolina, and South Carolina are the only jurisdictions to have all counties at low Community Levels.
To check your COVID-19 Community Level, visit COVID Data Tracker. To learn which prevention measures are recommended based on your COVID-19 Community Level, visit COVID-19 Community Level and COVID-19 Prevention.
*CDC recommends use of COVID-19 Community Levels to determine the impact of COVID-19 on communities and to take action. CDC also provides Community Transmission Levels to describe the amount of COVID-19 spread within each county. Healthcare facilities use Community Transmission Levels to determine infection control interventions.
**Includes the 50 states, the District of Columbia, and Puerto Rico.


Reported Cases
As of October 26, 2022, the current 21-day average of weekly new cases (37,683) decreased 25.1% compared with the previous 21-day average (50,328). A total of 97,329,787 COVID-19 cases have been reported in the United States as of October 26, 2022.
Variant Proportions
CDC Nowcast projections* for the week ending October 29, 2022, estimate that the combined national proportion of lineages designated as Omicron will continue to be 100%. There are eight lineages designated as Omicron with estimates above 1%: BA.5—and four of its sublineages (BQ.1, BQ.1.1, BF.7, and BA.5.2.6)—BA.4.6, BA.2.75, and BA.2.75.2. The predominant Omicron lineage is BA.5, projected to be 49.6% (95% PI 45.3-53.9%).
The national proportion of BQ.1 is projected to be 14.0% (95% PI 11.2-17.5%), BQ.1.1 is projected to be 13.1% (95% PI 9.8-17.3%), BA.4.6 is projected to be 9.6% (95% PI 8.6-10.7%), BF.7 is projected to be 7.5% (95% PI 6.6-8.5%), BA.5.2.6 is projected to be 2.8% (95% PI 2.3-3.5%), BA.2.75 is projected to be 1.8% (95% PI 1.5-2.2%), and BA.2.75.2 is projected to be 1.2% (95% PI 0.9-1.6%). See COVID Data Tracker for current data.
97,329,787
Total Cases Reported
37,683
Current 21-Day Average**
50,328
Previous 21-Day Average
-25.1%
Change in 21-Day Average since Previous Week
*CDC uses Nowcast projections to predict current variant proportions circulating in the United States. The median time from specimen collection to sequence data reporting is about 3 weeks. As a result, weighted estimates for the most recent few weeks may be unstable or unavailable. View Nowcast estimates on CDC’s COVID Data Tracker website on the Variant Proportions page.
**Historical cases are excluded from weekly new cases and 21-day average calculations until they are incorporated into the dataset for the applicable date. Of historical cases reported retroactively, none were reported in the current week and none were reported in the prior week.
Daily Trends in COVID-19 Cases in the United States Reported to CDC

Vaccinations
COVID-19 Vaccine Primary Series
As of October 26, 2022, 636.9 million vaccine doses have been administered in the United States. Overall, about 266.0 million people, or 80.1% of the total U.S. population, have received at least one dose of vaccine. About 226.9 million people, or 68.4% of the total U.S. population, have completed a primary series.*
636,871,557
Vaccine Doses Administered
266,031,472
People who received at least one dose (80.1% of the U.S. population)
226,933,827
People who are fully vaccinated* (68.4% of the U.S. population)
+0.1
Percentage point change from last week
+0.2%
Percentage point change from last week
*Represents the number of people who have received the second dose in a two-dose COVID-19 vaccine series (such as the Pfizer-BioNTech, Moderna, or Novavax vaccines) or one dose of the single-shot Johnson & Johnson’s Janssen vaccine.
Daily Change in the Total Number of Administered COVID-19 Vaccine Doses Reported to CDC by the Date of Administration, United States

7-Day moving average

COVID-19 Vaccine Boosters
Of those who have completed a primary series, about 111.8 million people have received a booster dose,* and more than 22.88 million people have received an updated (bivalent) booster dose. But 49.3% of the total booster-eligible population has not yet received a booster dose. Booster dose eligibility varies by age and health condition. Learn more about who is eligible.
144,909,794
Booster Doses Administered
111,843,722
Population ≥ 5 Years of Age with a 1st booster dose*
27,775,103
Population ≥ 50 Years of Age with a 2nd booster dose**
49.4%
Percentage of the Population ≥ 5 Years of Age with a 1st booster dose
41.9%
Percentage of the Population ≥ 50 Years of Age with a 2nd booster dose
+0.1
Percentage point change from last week
+1.3
Percentage point change from last week
*Represents the number of people who have completed a primary series and have received another dose of COVID-19 vaccine since August 13, 2021. This includes people who received their first additional dose or booster dose.
**Represents the number of people who have completed a primary series and have received two subsequent doses of COVID-19 vaccine since August 13, 2021. This includes people who received two booster doses and people who received one additional dose and one booster dose.
COVID-19 Booster Dose Administration, United States


5,445,602
Total New Admissions
3,249
Current 7-Day Average
3,217
Prior 7-Day Average
+1.0%
Change in 7-Day Average
The start of consistent reporting of hospital admissions data was August 1, 2020.
Daily Trends in Number of New COVID-19 Hospital Admissions in the United States

New admissions are pulled from a 10 am EDT snapshot of the HHS Unified Hospital Data – Analytic Dataset. Due to potential reporting delays, data from the most recent 7 days, as noted in the figure above with the grey bar, should be interpreted with caution. Small shifts in historic data may also occur due to changes in the Centers for Medicare & Medicaid Services (CMS) Provider of Services file, which is used to identify the cohort of included hospitals.
COVID-NET: Hospitalization Rates among Adults Ages 85 Years and Older
CDC’s Coronavirus Disease 2019-Associated Hospitalization Surveillance Network (COVID-NET) shows that COVID-19-associated hospitalizations continue to decline among all age groups, including adults ages 65 years and older. Among adults ages 85 years and older, the age group with the highest rate of COVID-19-associated hospitalization, rates (per 100,000 population) have decreased by more than 35% over the past two months, from 83.8 for the week ending August 6, 2022, to 52.4 for the week ending October 8, 2022.
Weekly Rates of COVID-19-Associated Hospitalizations among Adults Ages 85 Years and Older
 10/27/22")
The Coronavirus Disease 2019 (COVID-19)-Associated Hospitalization Surveillance Network (COVID-NET) is an additional source for hospitalization data collected through a network of more than 250 acute-care hospitals in 14 states (representing ~10% of the U.S. population). Detailed data on patient demographics, including race/ethnicity, underlying medical conditions, medical interventions, and clinical outcomes, are collected using a standardized case reporting form.
Deaths
The current 21-day average of new deaths (373) decreased 13.7% compared with the previous 21-day average (432). As of October 26, 2022, a total of 1,066,351 COVID-19 deaths have been reported in the United States.
1,066,351
Total Deaths Reported
373
Current 21-Day Average*
432
Prior 21-Day Average
-13.7%
Change in 21-Day Average Since Prior Week
*Historical deaths are excluded from the weekly new deaths and 21-day average calculations until they are incorporated into the dataset by their applicable date. Of 1,031 historical deaths reported retroactively, 562 were reported in the current week and none were reported in the prior week.

Testing
The percentage of COVID-19 NAATs (nucleic acid amplification tests)* that are positive is increasing in comparison to the previous week. The 7-day average of percent positivity from NAATs is now 8.5%. The 7-day average number of tests reported for October 14–20, 2022, was 328,658, down 16.3% from 392,847 for the prior 7 days.
973,505,408
Total Tests Reported
328,658
7-Day Average Tests Reported
8.5%
7-Day Average % Positivity
8.0%
Previous 7-Day Average % Positivity
+0.51
Percentage point change in 7-Day Average % Positivity since Prior Week
*Test for SARS-CoV-2, the virus that causes COVID-19
COVID-19 NAAT Laboratory Test 7-day Percent Positivity by State/Territory

Wastewater Surveillance
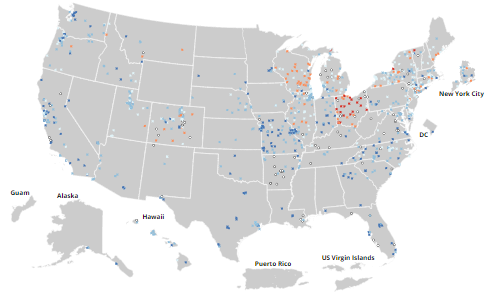
COVID Data Tracker’s Wastewater Surveillance tab tracks levels, changes, and detections of SARS-CoV-2* viral RNA in wastewater at over 1,100 testing sites across the country.
Currently, about 34% of the country is reporting moderate to high SARS-CoV-2 levels in wastewater. About 10% of sites reporting wastewater data are currently seeing some of the highest levels for those sites since December 1, 2021. About 44% of sites are experiencing a decrease in SARS-CoV-2 levels, and about 50% are reporting an increase.
For more information on how to use wastewater data, visit CDC’s wastewater surveillance website.
*The virus that causes COVID-19
SARS-CoV-2 Levels in Wastewater by Site

0% denotes that levels are the lowest they have been at the site; 100% denotes that levels are the highest they have been at the site.