Recommendations for Fully Vaccinated People
COVID-19 Homepage

COVIDView Summary ending November 7, 2020
Key Updates for Week 45, ending November 7, 2020
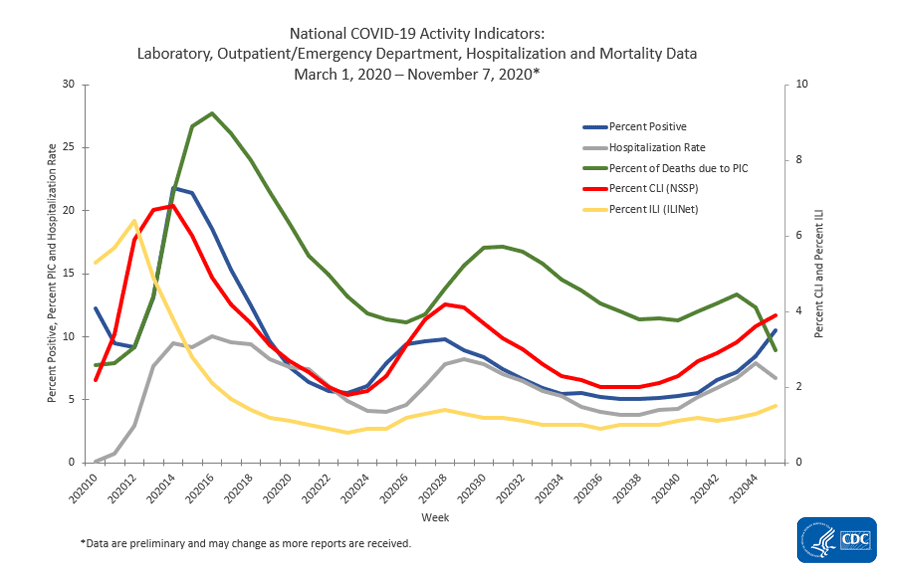
Nationally, surveillance indicators tracking levels of SARS-CoV-2 virus circulation and associated illnesses have been increasing since September. The percentage of deaths due to pneumonia, influenza and COVID-19 (PIC) increased during the first three weeks of October. Both COVID-19 related hospitalizations and PIC mortality for the most recent weeks may increase as more data are received.
Virus: Public Health, Commercial and Clinical Laboratories
Nationally, the overall percentage of respiratory specimens testing positive for SARS-CoV-2, the virus causing COVID-19, increased from 8.4% during week 44 to 10.5% during week 45. Percent positivity increased among all age groups. Regionally, the percentages of respiratory specimens testing positive for SARS-CoV-2 increased in all ten HHS regions.
Mild/Moderate Illness: Outpatient and Emergency Department Visits
Nationally, the overall percentage of visits to outpatient providers or emergency departments (EDs) for influenza-like illness (ILI) or COVID-like illness (CLI) has been increasing since mid-September; CLI and ILI increased in week 45 compared with week 44. All ten surveillance regions reported an increase in at least one indicator of mild/moderate illness.
Severe Disease: Hospitalizations and Deaths
Since the week ending September 26 (MMWR week 39), overall weekly hospitalization rates have increased. Overall increases have been driven primarily by an increase in rates among adults aged 50 years and older. Based on death certificate data, the percentage of deaths attributed to PIC for week 45 was 8.9% and, while declining compared to week 44 (12.3%), remains above the epidemic threshold. The weekly percentages of deaths due to PIC increased during the first three weeks of October and are expected to increase for the most recent weeks as additional data are reported. The hospitalization rate for the most recent week is expected to be higher as additional data are reported.
All data are preliminary and may change as more reports are received. A description of the surveillance systems summarized in COVIDView, including methodology and detailed descriptions of each data component, is available on the surveillance methods page.
Key Points
- Nationally, all surveillance indicators included in COVIDView are showing increases in SARS-CoV-2 virus circulation and associated illnesses and deaths.
- The percentage of specimens testing positive for SARS-CoV-2, the percentages of visits to EDs or outpatient providers for ILI and CLI, and COVID-19-associated hospitalization rates have been increasing since September. The hospitalization rate for the most recent week is expected to be higher as additional data are reported in future weeks.
- The percentage of deaths due to PIC has been increasing since the beginning of October. Data for the most recent two weeks currently show a decline, but that is likely to change as additional death certificates are processed.
- At least one indicator used to monitor COVID-19 activity is increasing in each of the ten HHS regions, and many regions are reporting increases in multiple indicators.
- The percentages of specimens testing positive for SARS-CoV-2 increased in all ten regions.
- The percentages of visits for ILI, CLI or both increased in all ten regions.
- For some indicators and regions, the increases have been small but consistent from week to week over the last several weeks; other indicators have increased more rapidly in some regions.
- Two regions (Regions 7 [Central] and 8 [Mountain]) have a least two surveillance indicators that were higher during week 45 than at any other time during the pandemic.
- The overall cumulative COVID-19-associated hospitalization rate through the week ending November 7, 2020 was 217.2 hospitalizations per 100,000 population.
- Since the week ending September 26 (MMWR week 39), weekly hospitalization rates have increased. Overall increases have been driven primarily by an increase in rates among adults aged 50 years and older. Weekly hospitalization rates among children have had a two-week sustained increase from October 24 (MMWR week 43) to November 7 (MMWR week 45). Data for the most recent weeks may change as additional admissions occurring during those weeks are reported.
- The age-adjusted hospitalization rate for Hispanic or Latino persons was approximately 4.2 times that of non-Hispanic White persons. Age-adjusted hospitalization rates for non-Hispanic American Indian or Alaska Native persons and non-Hispanic Black persons were approximately 4.1 and 3.9 times those of non-Hispanic White persons, respectively.
- These surveillance systems aim to provide the most complete data available. Estimates from previous weeks are subject to change as data are updated with the most complete data available.
Based on data reported to CDC by public health laboratories and a subset of clinical and commercial laboratories in the United States, 71,827,520 specimens were tested for SARS-CoV-2 using a molecular assay since March 1, 2020. The percentages of specimens testing positive for SARS-CoV-2 each week, based on week of specimen collection, are summarized below.
Nationally, during week 45, 3,128,187 specimens were tested for SARS-CoV-2 for diagnostic purposes and 328,119 (10.5%) were positive. This is an increase compared with week 44, during which 8.4% of specimens tested were positive. The percentages of specimens testing positive increased among all age groups.
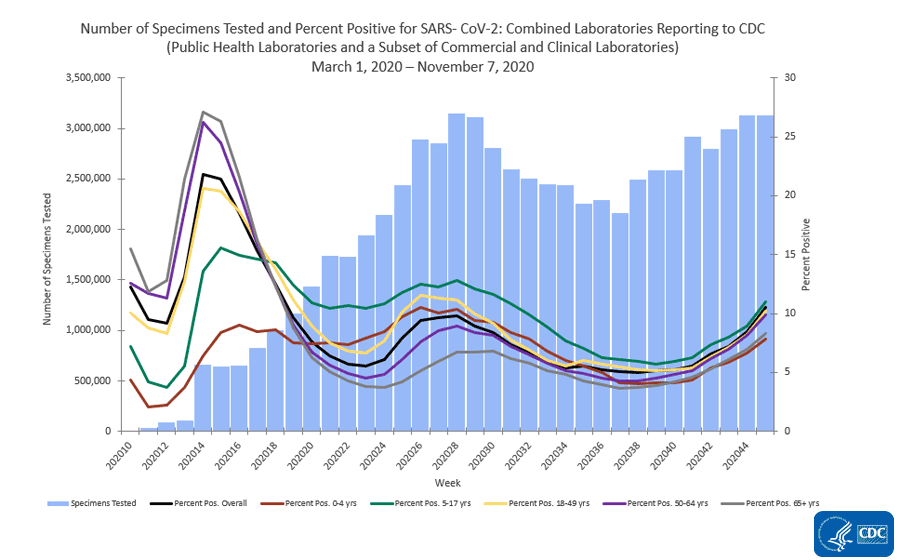
*Note: Different laboratory types came on board with testing during different weeks. This graph includes public health laboratory data beginning in week 10, clinical laboratory data beginning in week 11 and commercial laboratory data beginning in week 14.
The percentages of specimens testing positive for SARS-CoV-2 increased in all ten HHS regionsExternal. The regions with the highest percent positivity during week 45 were in the central part of the country, Regions 5 (Midwest, 16.2%), 6 (South Central, 13.7%), 7 (Central, 23.5%) and 8 (Mountain, 15.5%). These regions also reported the largest increases in percent positivity during week 45 compared with week 44.
Additional virologic surveillance information: Surveillance Methods
Outpatient/Emergency Department Illness
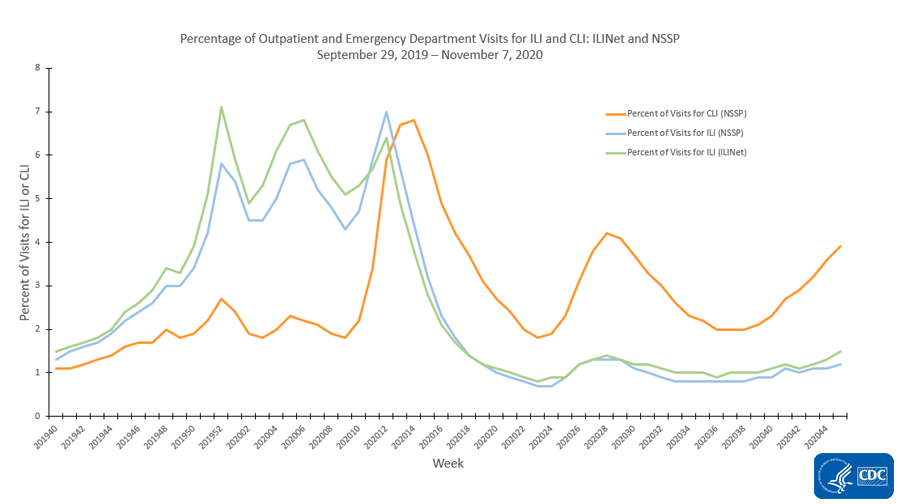
Two syndromic surveillance systems, the U.S. Outpatient Influenza-like Illness Surveillance Network (ILINet) and the National Syndromic Surveillance Project (NSSP), are being used to monitor trends in outpatient and emergency department (ED) visits that may be associated with COVID-19 illness. Each system monitors activity in a slightly different set of providers/facilities. ILINet provides information about visits to outpatient providers or emergency departments for influenza-like illness (ILI; fever plus cough and/or sore throat) and NSSP provides information about visits to EDs for ILI and COVID-like illness (CLI; fever plus cough and/or shortness of breath or difficulty breathing). Some EDs contribute ILI data to both ILINet and NSSP. Both systems are currently being affected by changes in health care seeking behavior, including increased use of telemedicine and increased social distancing. These changes affect the numbers of people seeking care in the outpatient and ED settings and their reasons for doing so.
Nationally, the overall percentage of visits to outpatient providers or EDs for ILI or CLI has been increasing since mid-September. During week 45, the percentages of ED visits captured in NSSP for CLI and ILI were 3.9% and 1.2%, respectively and, compared to week 44, increased (CLI) or remained stable (change of≤0.1%; ILI). In ILINet, 1.5% of visits reported were for ILI and, while increasing compared with week 44 (1.3%), remains below the national baseline (2.4% for October 2019 through September 2020; 2.6% since October 2020) for the 30th consecutive week. This level of ILI is typical for ILINet during this time of year.
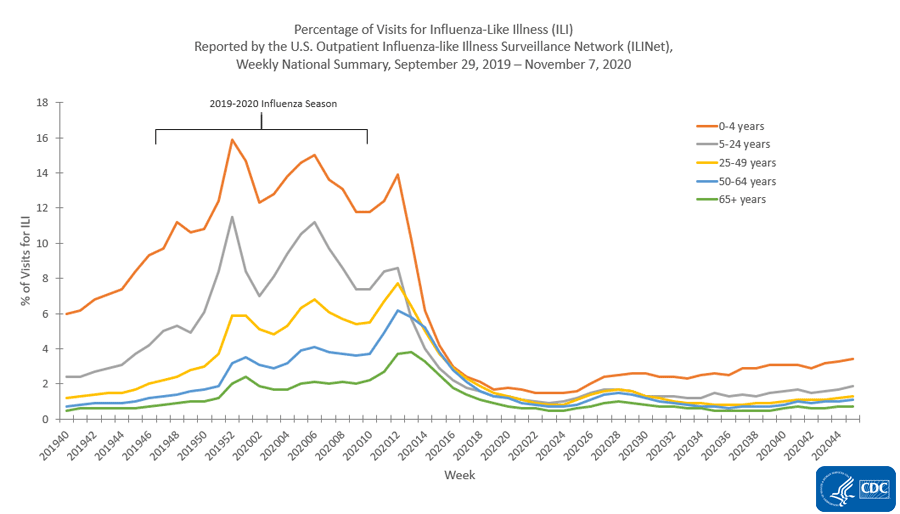
For those 5–24 years, the percentage of visits for ILI increased during week 45 (1.9%) compared with week 44 (1.7%). For all other age groups, (0–4 years, 25–49 years, 50–64 years, 65 years and older) the percentage of visits for ILI remained stable (change of ≤0.1%). All age groups have experienced an increasing percentage of visits for ILI since September.
On a regional levelExternal, all ten regions reported an increase in at least one indicator of mild/moderate CLI or ILI in week 45 compared to week 44 and eight regions (Regions 2 [New Jersey/New York/Puerto Rico], 3 [Mid-Atlantic], 5 [Midwest], 6 [Southwest], 7 [Central], 8 [Mountain], 9 [South West/Coast], and 10 [Pacific Northwest]) reported an increase in at least two indicators. The percentage of visits for ILI to ILINet providers remained below the region-specific baseline in 9 regions; however, Region 7 (Central) reported ILI activity above baseline due to increased COVID activity.
ILI Activity Levels
Data collected in ILINet are used to produce a measure of ILI activity for all 50 states, Puerto Rico, the U.S. Virgin Islands, the District of Columbia, and New York City and for each core-based statistical area (CBSA) where at least one provider is located. The mean reported percentage of visits due to ILI for the current week is compared with the mean reported during non-influenza weeks, and the activity levels correspond to the number of standard deviations below, at, or above the mean.
The number of jurisdictions at each activity level during week 45 and the previous week are summarized in the table below.
| Activity Level | Number of Jurisdictions | Number of CBSAs | ||
| Week 45 (Week ending Nov. 7, 2020) |
Week 44 (Week ending Oct. 31, 2020) |
Week 45 (Week ending Nov. 7, 2020) |
Week 44 (Week ending Oct. 31, 2020) |
|
| Very High | 1 | 0 | 1 | 0 |
| High | 0 | 0 | 1 | 2 |
| Moderate | 0 | 1 | 4 | 5 |
| Low | 4 | 1 | 40 | 38 |
| Minimal | 49 | 52 | 540 | 556 |
| Insufficient Data | 1 | 0 | 343 | 328 |
*Note: Data collected in ILINet may disproportionally represent certain populations within a state and may not accurately depict the full picture of influenza activity for the whole state. Differences in the data presented here by CDC and independently by some state health departments likely represent differing levels of data completeness with data presented by the state likely being the more complete.
Additional information about medically attended outpatient and emergency department visits for ILI and CLI: Surveillance Methods
The COVID-19-Associated Hospitalization Surveillance Network (COVID-NET) conducts population-based surveillance for laboratory-confirmed COVID-19-associated hospitalizations in select counties participating in the Emerging Infections Program (EIP) and the Influenza Hospitalization Surveillance Project (IHSP).
A total of 70,825 laboratory-confirmed COVID-19-associated hospitalizations were reported by sites between March 1, 2020, and November 7, 2020. The overall cumulative hospitalization rate was 217.2 per 100,000 population.
Since the week ending September 26 (MMWR week 39), overall weekly hospitalization rates have increased, driven primarily by an increase in rates among adults aged 50 and older. Weekly hospitalization rates among children have had a two-week sustained increase from October 24 (MMWR week 43) to November 7 (MMWR week 45). The hospitalization rate for the most recent week is expected to be higher as additional data are reported in future weeks.
Among the 70,825 laboratory-confirmed COVID-19-associated hospitalizations, 67,259 (95%) had information on race and ethnicity, while collection of race and ethnicity was still pending for 3,566 (5%) cases. When examining overall age-adjusted rates by race and ethnicity, the rate for Hispanic or Latino persons was approximately 4.2 times the rate among non-Hispanic White persons. Rates for non-Hispanic American Indian or Alaska Native persons and non-Hispanic Black persons were approximately 4.1 and 3.9 times the rate among non-Hispanic White persons, respectively.
When examining age-stratified crude hospitalization rates by race and ethnicity, compared with non-Hispanic White persons in the same age group, crude hospitalization rates were 6.5 times higher among Hispanic or Latino persons aged 0–17 years; 7.3 times higher among Hispanic or Latino persons aged 18–49 years; 5.2 times higher among non-Hispanic American Indian or Alaska Native persons aged 50–64 years; and 3.1 times higher among non-Hispanic Black persons aged ≥65 years.
| Age Category | Non-Hispanic American Indian or Alaska Native |
Non-Hispanic Black | Hispanic or Latino | Non-Hispanic Asian or Pacific Islander | Non-Hispanic White | |||||
|---|---|---|---|---|---|---|---|---|---|---|
| Rate1 | Rate Ratio2,3 | Rate1 | Rate Ratio2,3 | Rate1 | Rate Ratio2,3 | Rate1 | Rate Ratio2,3 | Rate1 | Rate Ratio2,3 | |
| 0—17 years | 126.6 | 2.4 | 137.4 | 2.6 | 125.9 | 2.4 | 49.2 | 0.9 | 52.0 | 1.0 |
| 18—49 years | 1532.5 | 4.9 | 965.4 | 3.1 | 989.7 | 3.2 | 272.4 | 0.9 | 313.9 | 1.0 |
| 50—64 years | 2959.0 | 3.4 | 2334.5 | 2.7 | 2172.8 | 2.5 | 698.3 | 0.8 | 873.7 | 1.0 |
| 65+ years | 4416.0 | 2.1 | 4205.1 | 2.0 | 3886.1 | 1.8 | 1571.8 | 0.7 | 2120.2 | 1.0 |
| Overall rate4,5 (age-adjusted) | 1943.6 | 3.1 | 1538.1 | 2.4 | 1460.5 | 2.3 | 496.9 | 0.8 | 627.9 | 1.0 |
1 COVID-19-associated hospitalization rates by race and ethnicity are calculated using COVID-NET hospitalizations with known race and ethnicity for the numerator and NCHS bridged-race population estimates for the denominator.
2 For each age category, rate ratios are the ratios between crude hospitalization rates within each racial and ethnic group and the crude hospitalization rate among non-Hispanic White persons in the same age category.
3 The highest rate ratio in each age category is presented in bold.
4 Overall rates are adjusted to account for differences in age distributions within race and ethnicity strata in the COVID-NET catchment area; the age strata used for the adjustment include 0–17, 18–49, 50–64, 65-74, 75-84 and 85+ years.
5 Starting the week ending December 4, Maryland temporarily halted data transmission on COVID-19-associated hospitalizations, impacting COVID-NET age-adjusted rate calculations.
Non-Hispanic White persons and non-Hispanic Black persons represented the highest proportions of hospitalizations reported to COVID-NET, followed by Hispanic or Latino, non-Hispanic Asian or Pacific Islander, and non-Hispanic American Indian or Alaska Native persons. However, some racial and ethnic groups are disproportionately represented among hospitalizations compared with the overall population of the catchment area. Prevalence ratios were highest among non-Hispanic American Indian or Alaska Native persons, followed by non-Hispanic Black persons and Hispanic or Latino persons.
| Non-Hispanic American Indian or Alaska Native | Non-Hispanic Black | Hispanic or Latino | Non-Hispanic Asian or Pacific Islander | Non-Hispanic White | |
|---|---|---|---|---|---|
| Proportion of COVID-NET hospitalizations1 | 1.3% | 30.7% | 22.8% | 5.2% | 34.9% |
| Proportion of population in COVID-NET catchment | 0.7% | 17.9% | 14.1% | 8.9% | 58.5% |
| Prevalence ratios2 | 1.9 | 1.7 | 1.6 | 0.6 | 0.6 |
1 Persons of multiple races (0.3%) or unknown race and ethnicity (4.8%) are not represented in the table but are included as part of the denominator.
2 Prevalence ratio is calculated as the ratio of the proportion of COVID-NET hospitalizations over the proportion of population in COVID-NET catchment area.
For underlying medical conditions, data were restricted to cases reported during March 1–May 31, 2020, due to delays in reporting. During this time frame, sampling was conducted among hospitalized adults; therefore, weighted percentages are reported. No sampling was conducted among hospitalized children. Among 8,426 sampled adults hospitalized during March 1–May 31 with information on underlying medical conditions, 90.6% had at least one reported underlying medical condition. The most reported underlying medical conditions were hypertension, obesity, metabolic disease, and cardiovascular disease. Among 265 children hospitalized during March 1–May 31 with information on underlying conditions, 50.9% had at least one reported underlying medical condition. The most reported underlying medical conditions were obesity, asthma, and neurologic disease.
Additional data on demographics, signs and symptoms at admission, underlying conditions, interventions, outcomes, and discharge diagnoses, stratified by age, sex, and race and ethnicity, are available.
Additional hospitalization surveillance information: Surveillance Methods | Additional rate data | Additional demographic and clinical data
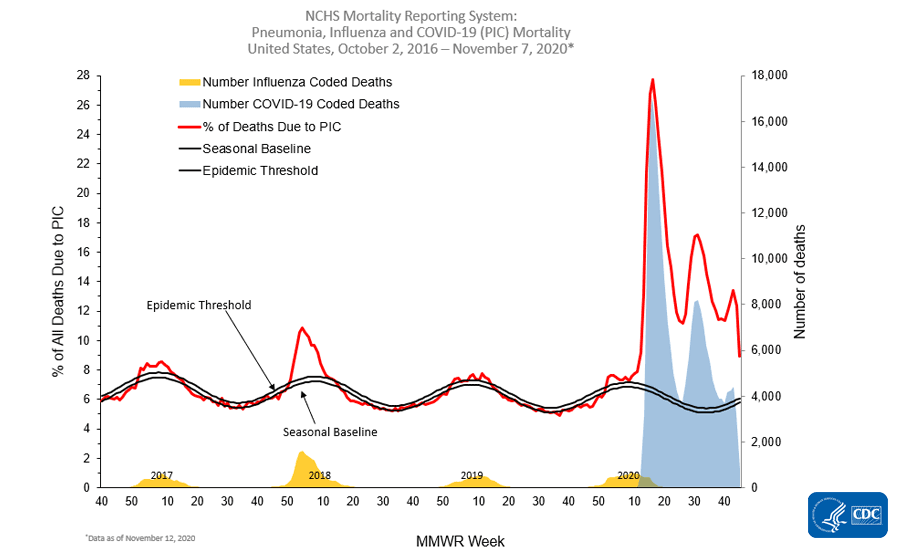
The National Center for Health Statistics (NCHS) collects death certificate data from vital statistics offices for all deaths occurring in the United States. Based on death certificate data available on November 12, 2020, the percentage of deaths attributed to pneumonia, influenza, or COVID-19 (PIC) for week 45 was 8.9% and, while it is declining compared with the percentage during week 44, it remains above the epidemic threshold. The weekly percentage of deaths due to PIC declined from a second peak at the end of July through mid- September, remained approximately stable from the week ending September 19 through the week ending October 3, and increased during the first three weeks of October. Data for the most recent two weeks currently show a decline, but percentages for recent weeks will likely increase as more death certificates are processed.
Weekly mortality surveillance data include a combination of machine coded and manually coded causes of death collected from death certificates. The percentage of deaths due to PIC is higher among manually coded records than more rapidly available machine coded records. Due to the additional time needed for manual coding, the initially reported PIC percentages may be lower than percentages calculated from final data.
*Data during recent weeks are incomplete because of the lag in time between when the death occurred and when the death certificate is completed, submitted to NCHS and processed for reporting purposes. It is possible that a death certificate includes both influenza and COVID as a cause of death; therefore, the number of influenza and COVID coded deaths may not be mutually exclusive.
Additional NCHS mortality surveillance information: Surveillance Methods | Provisional Death Counts for COVID-19
