National and State Diabetes Trends
‹View Table of Contents
Diabetes Incidence and Prevalence

Diabetes was the eighth leading cause of death in the United States in 2020.12 Adults 50 or older with diabetes die 4.6 years earlier, develop disability 6 to 7 years earlier, and spend about 1 to 2 more years in a disabled state than adults without diabetes.13
About 37.3 million people—or 11.3% of the US population—had diabetes (diagnosed or undiagnosed) in 2019. This total included 37.1 million adults 18 or older, or 14.7% of all US adults. About 8.5 million of these adults had diabetes but were not aware that they had it or did not report that they had it.10
After almost 2 decades of continual increases, the incidence of diagnosed cases of diabetes (type 1 and type 2 combined) among adults in the United States decreased during 2009–2019.10 Diabetes incidence is the rate of new cases of diagnosed diabetes. About 1.4 million new cases of diabetes (5.9 per 1,000 people) were diagnosed among US adults 18 or older in 2019.
Figure 1 shows diabetes incidence trends during 2001–2019, with a generally declining curve after 2009. The decrease in diabetes incidence may be due to multiple factors that cannot be determined by current data. Compared to adults 18 to 44, incidence rates of diagnosed diabetes are higher among adults 45 to 64 and those 65 or older.10
Figure 1. Trends in Incidence of Diagnosed Diabetes Among Adults Aged 18 Years or Older, United States, 2001–2019
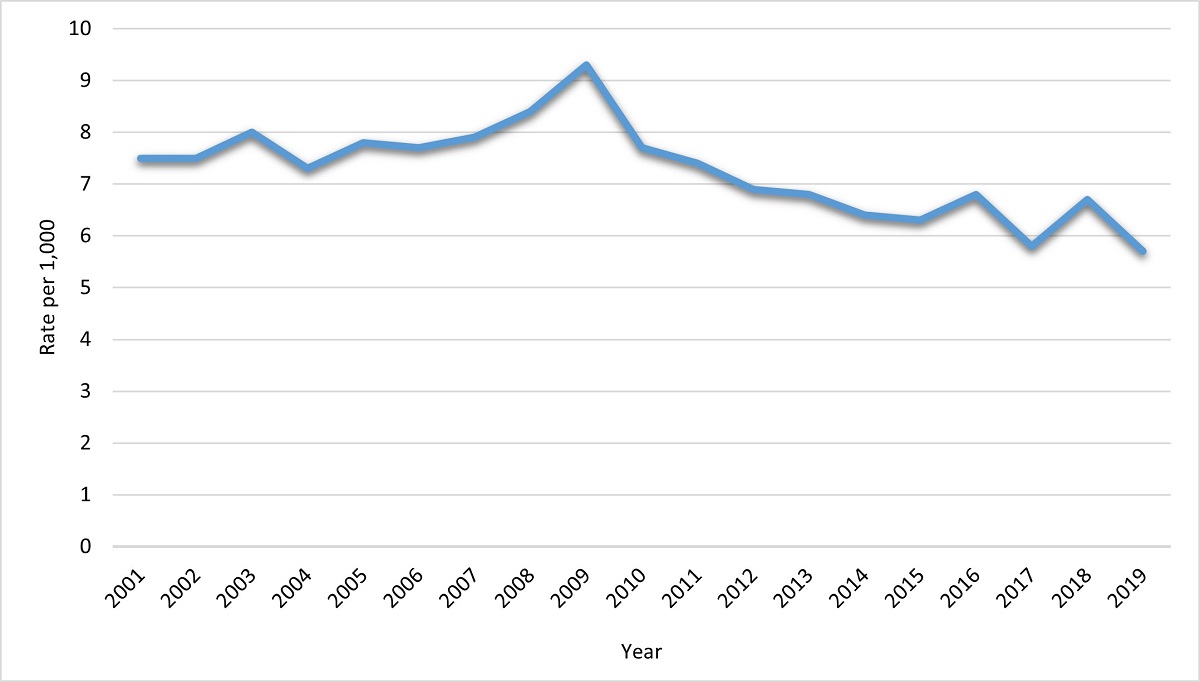
Notes: Rates are age-adjusted to the 2000 US Census standard population. Figure adapted from CDC’s National Diabetes Statistics Report.
Data source: National Health Interview Survey, Centers for Disease Control and Prevention.
Diabetes prevalence is the total number of existing cases, including new cases. The prevalence of total and diagnosed diabetes among US adults 18 or older steadily increased from the time period of 2001–2004 to 2017–2020 (Figure 2). Similar trends were seen across all categories examined: age, sex, racial and ethnic group, education level.10 The increase in diabetes prevalence may be due in part to people living longer with diabetes because of improvements in self-management practices, lifestyle change interventions, and health care services.
Figure 2. Trends in Prevalence of Diagnosed Diabetes, Undiagnosed Diabetes, and Total Diabetes Among Adults Aged 18 Years or Older, United States, 2001–2004 to 2017–2020
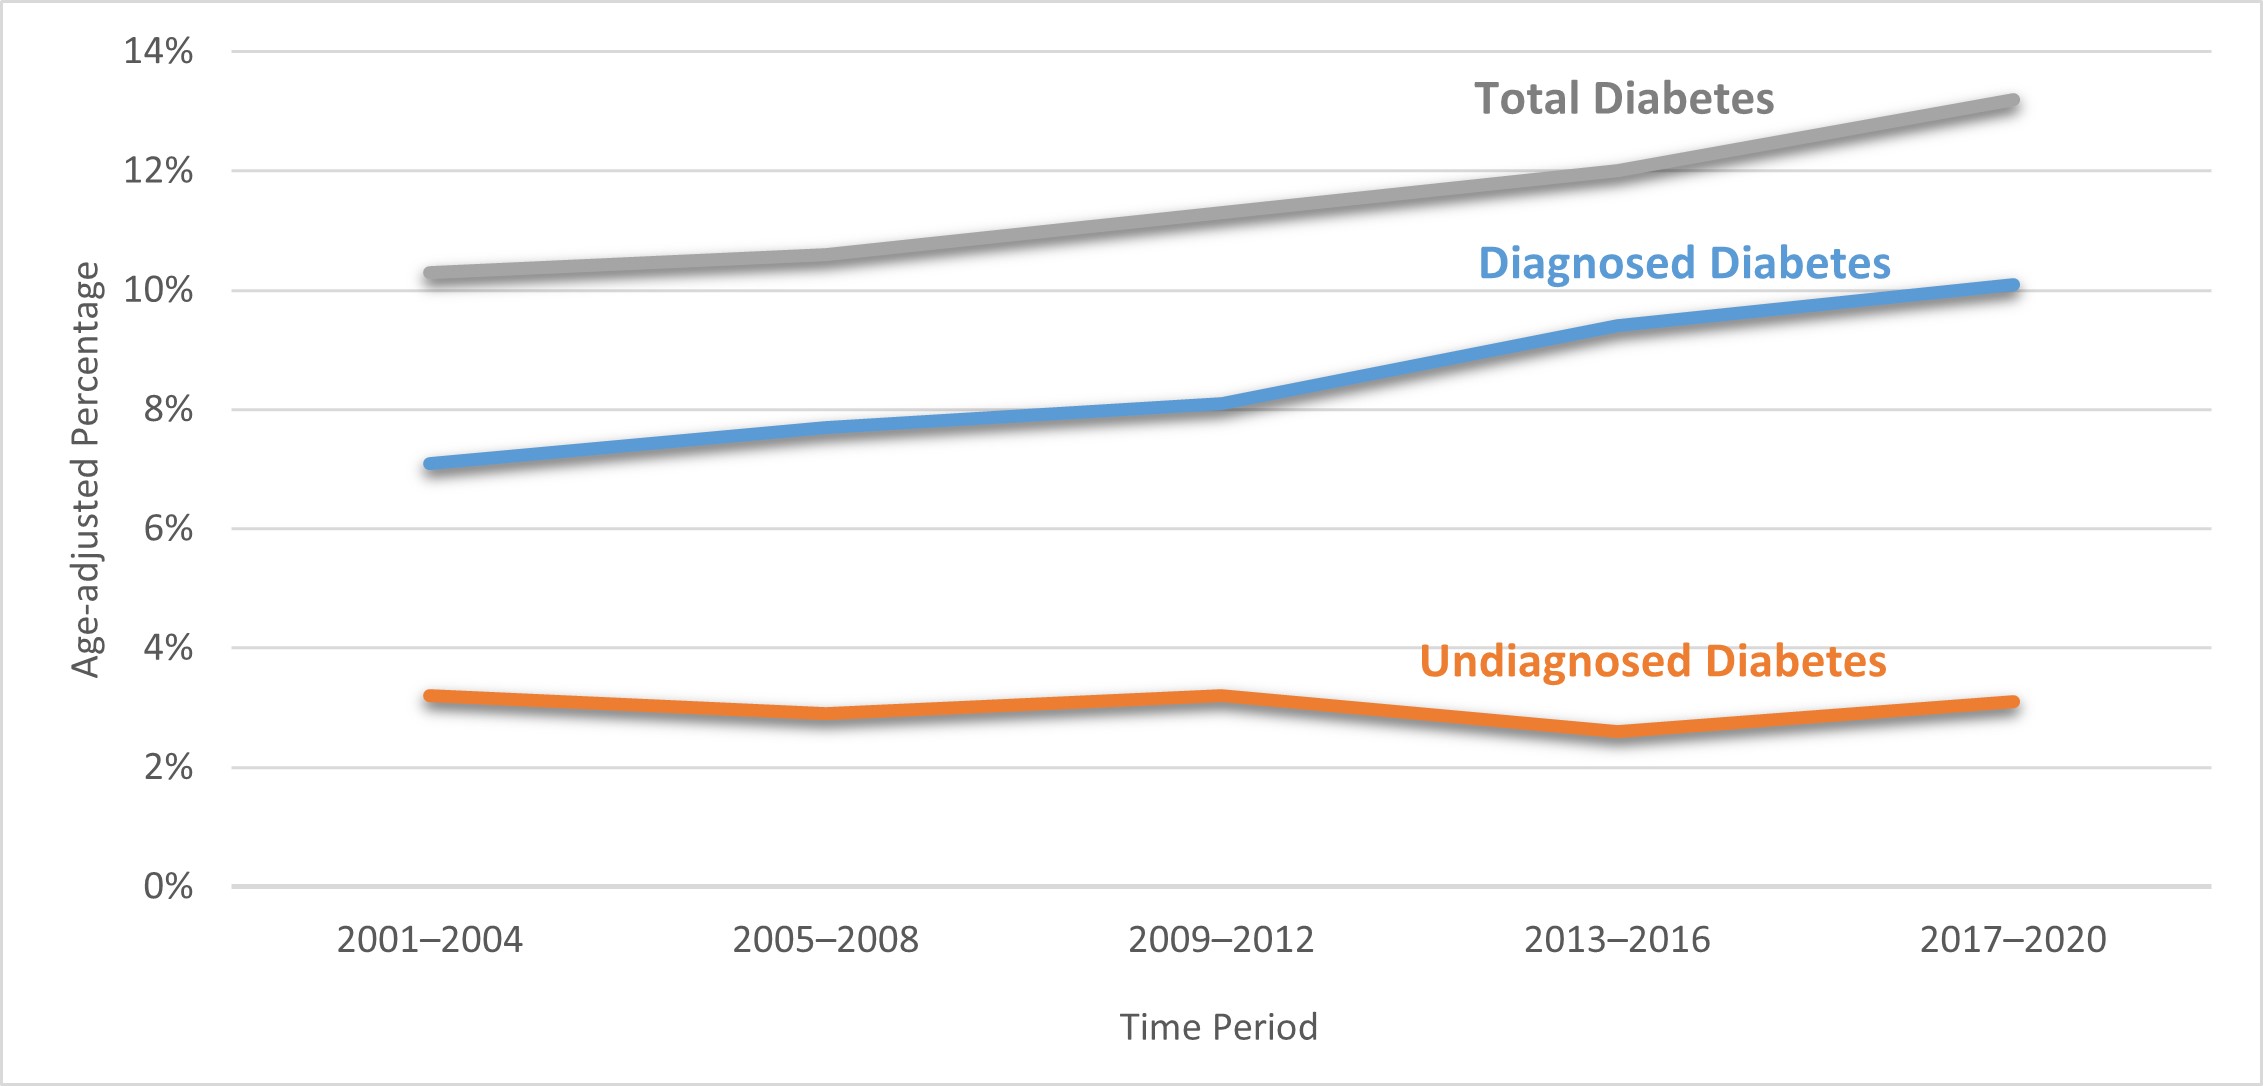
Notes: Percentages are age-adjusted to the 2000 US Census standard population. Diagnosed diabetes was based on self-report. Undiagnosed diabetes was based on fasting plasma glucose and A1C levels among people self-reporting no diabetes. Figure adapted from CDC’s National Diabetes Statistics Report.
Data source: National Health and Nutrition Examination Surveys, Centers for Disease Control and Prevention.
Risk Factors

Knowing the risk factors for diabetes is important for prevention and treatment. Type 1 diabetes is thought to be caused by an immune reaction, where the body attacks itself. Certain genes make people more likely to develop type 1 diabetes, and environmental factors may also play a part.14 This form of diabetes usually develops in children, teens, and young adults, but it can happen at any age. In the United States, non-Hispanic White people are more likely to develop type 1 diabetes than non-Hispanic Black and Hispanic people.15 Currently, there is no known way to prevent type 1 diabetes, which accounts for approximately 5–10% of all diabetes cases.14
Known risk factors for type 2 diabetes include having overweight or prediabetes, being 45 or older, having a family history of diabetes, and being physically active less than 3 times a week. In addition, people from some racial and ethnic minority groups are at higher risk of developing type 2 diabetes.15 Unlike type 1 diabetes, there are proven lifestyle changes (losing weight if overweight, eating healthier, and getting regular physical activity) that can address some of these risk factors.
For the time period 2015–2018, 89.9% of US adults 18 or older who had diagnosed diabetes were also considered to have overweight or obesity body mass index 25 kg/m2 or higher. In addition, 34.3% were considered physically inactive (less than 10 minutes a week of moderate or vigorous activity).10 The maps in Figure 3 demonstrate similarities in county-level prevalence of diagnosed diabetes, obesity, and physical inactivity.
Figure 3. County-Level Distribution of Diagnosed Diabetes, Obesity, and Physical Inactivity, 2019

Notes: Percentages are age-adjusted to the 2000 US Census standard population. Maps include all 50 states and Puerto Rico.
Data sources: United States Diabetes Surveillance System and Behavioral Risk Factor Surveillance System, Centers for Disease Control and Prevention.
For detailed data for each map, go to https://gis.cdc.gov/grasp/diabetes/DiabetesAtlas.html#. Under Surveillance click Open. Click on the “County” tab in the panel on the left, then select “All Counties.” Click on the “Indicators” tab and select “Burden/Magnitude” to see data for Diagnosed Diabetes or select “Risk Factors for Diabetes” to see data for Obesity or Physical Inactivity.
Members of some racial and ethnic minority groups are more likely to have diagnosed diabetes than non-Hispanic White people. During 2018–2019, American Indian or Alaska Native adults had the highest rates of diagnosed diabetes (14.5%) among all US racial and ethnic groups, followed by non-Hispanic Black (12.1%) and Hispanic (11.8%) adults (Figure 4). The prevalence of diagnosed diabetes among American Indian or Alaska Native people increased significantly from 2006 to 2013, but decreased significantly from 2013 to 2017.16 Deaths and newly treated end-stage kidney disease related to diabetes also decreased among American Indian or Alaska Native, Hispanic, and non-Hispanic Black populations from 2000 to 2016.17
In addition, the percentage of adults with diagnosed or undiagnosed diabetes varied significantly during 2017–2018 by racial and ethnic group and among Hispanic and non-Hispanic Asian subgroups. Mexican (14.4%) and Puerto Rican (12.4%) subgroups had the highest prevalence of diabetes among adults of Hispanic origin. Among non-Hispanic Asian people, the highest prevalence was among Asian Indian (12.6%) and Filipino (10.4%) populations.10
Figure 4. Percentage of Adults Aged 18 Years or Older With Diagnosed Diabetes, by Racial or Ethnic Group, United States, 2018–2019
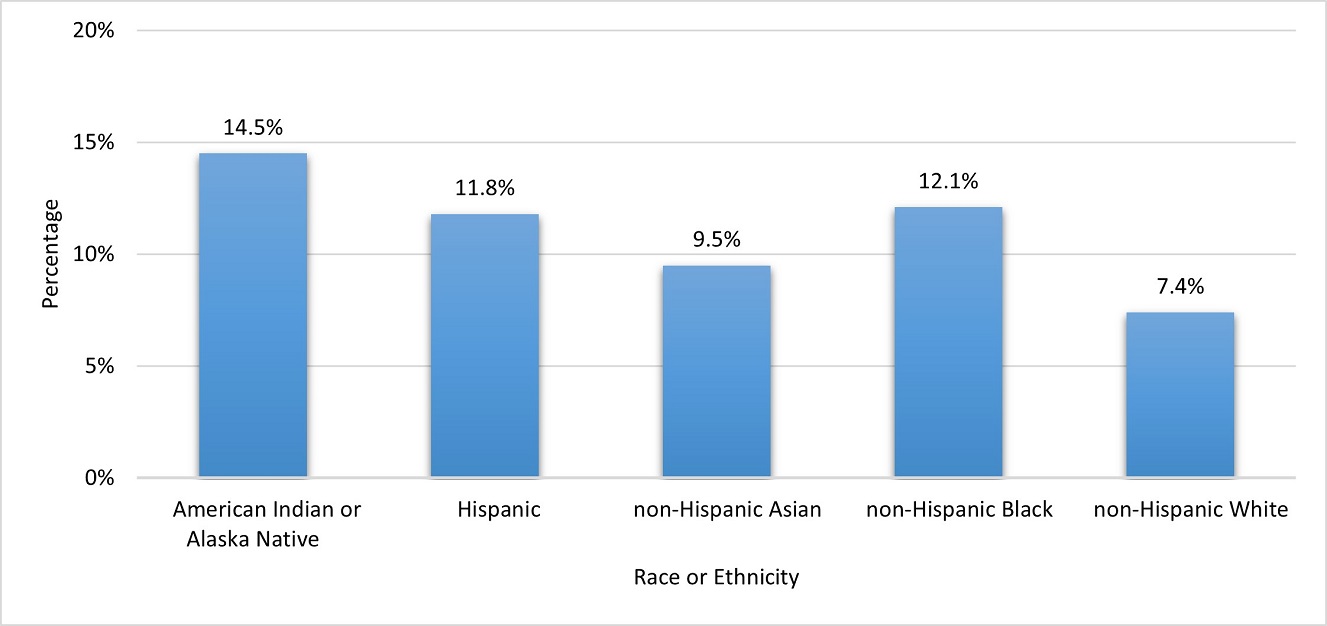
Notes: Percentages are age-adjusted to the 2000 US Census standard population. Figure adapted from CDC’s National Diabetes Statistics Report.
Data sources: National Health Interview Survey, Centers for Disease Control and Prevention, and the Indian Health Service National Data Warehouse (American Indian or Alaska Native data).
Differences in diabetes prevalence are also seen by socioeconomic position, which is defined by level of education attained and the income-to-poverty ratio. For example, the prevalence of diabetes goes up as a person’s level of education goes down (Figure 5). As a result, people with less than a high school diploma are more likely to be diagnosed with diabetes than people with higher levels of education.18
Figure 5. Percentage of Adults Aged 18 Years or Older With Diagnosed Diabetes, by Education Level, United States, 2018–2019
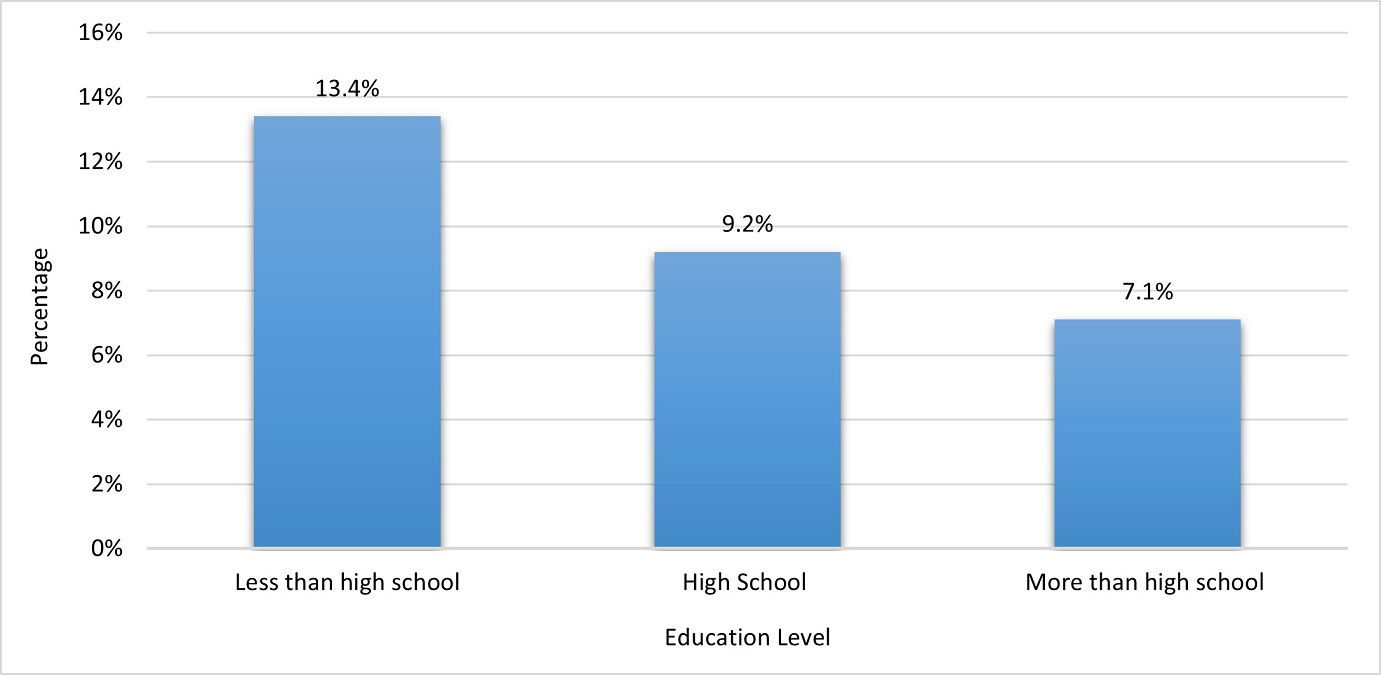
Notes: Percentages are age-adjusted to the 2000 US Census standard population. Figure adapted from CDC’s National Diabetes Statistics Report.
Data source: National Health Interview Survey, Centers for Disease Control and Prevention.
Research also shows that people with lower education levels are less likely to use preventive care practices, such as annual foot and eye exams, regular laboratory testing of blood sugar levels (using the hemoglobin A1C test), and diabetes self-management education and support services.19 In addition, the prevalence of diagnosed diabetes—overall and by sex—decreases as family income increases, demonstrating a socioeconomic disparity for people with diabetes (Figure 6).
Figure 6. Prevalence of Diagnosed Diabetes Among US Adults 18 or Older, by Family Income and Sex, 2018–2019
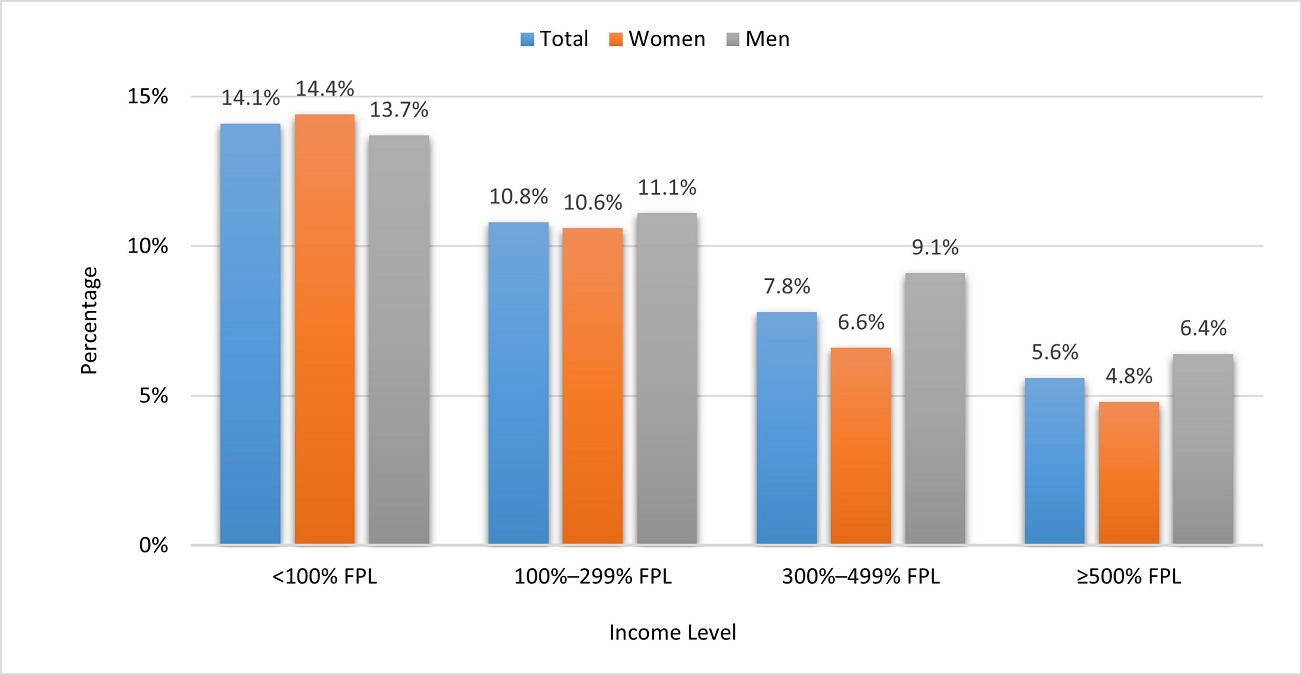
Notes: Income level based on the ratio of family income to the federal poverty level (FPL). Percentages are age-adjusted to the 2000 US Census standard population. Figure adapted from CDC’s National Diabetes Statistics Report.
Data source: National Health Interview Survey, Centers for Disease Control and Prevention.
Geographic Distribution of Diagnosed Diabetes in Adults
Diagnosed diabetes is prevalent across all 50 states, the District of Columbia, and the two US territories for which data is available (Guam and Puerto Rico). Table 1 shows the percentage of US adults who reported in 2018 that they had ever been told by a health care provider that they had diabetes. Estimates ranged from 6.6% in Colorado to 15.4% in Guam.20
| State or US Territory | Percentage of Adults 18 or Older With Diagnosed Diabetes | Comparison to the US Median | Rate of Newly Diagnosed Diabetes in Adults 18 to 79 | Comparison to the US Median |
|---|---|---|---|---|
| US Median | 9.8 | N/A | 7.8 | N/A |
| Alabama | 12.7 | 10.0 | ||
| Alaska | 8.7 | 6.4 | ||
| Arizona | 9.6 | 6.8 | ||
| Arkansas | 12.4 | 9.9 | ||
| California | 9.7 | 7.5 | ||
| Colorado | 6.6 | 6.0 | ||
| Connecticut | 8.4 | 7.0 | ||
| Delaware | 10.1 | 7.9 | ||
| District of Columbia | 9.2 | 4.8 | ||
| Florida | 10.5 | 7.6 | ||
| Georgia | 11.7 | 9.4 | ||
| Guam | 15.4 | 15.3 | ||
| Hawaii | 10.3 | 10.2 | ||
| Idaho | 9.2 | 6.4 | ||
| Illinois | 9.0 | 8.0 | ||
| Indiana | 11.2 | 10.0 | ||
| Iowa | 8.8 | 7.5 | ||
| Kansas | 10.4 | 8.5 | ||
| Kentucky | 12.1 | 8.6 | ||
| Louisiana | 12.9 | 11.2 | ||
| Maine | 8.7 | 7.8 | = | |
| Maryland | 10.8 | 8.9 | ||
| Massachusetts | 7.7 | 6.7 | ||
| Michigan | 10.2 | 8.4 | ||
| Minnesota | 7.9 | 6.1 | ||
| Mississippi | 12.9 | 9.8 | ||
| Missouri | 10.2 | 7.5 | ||
| Montana | 8.1 | 6.1 | ||
| Nebraska | 8.8 | 7.9 | ||
| Nevada | 9.6 | 7.1 | ||
| New Hampshire | 8.7 | 6.6 | ||
| New Jersey | 9.4 | 8.1 | ||
| New Mexico | 11.2 | 9.1 | ||
| New York | 9.8 | = | 7.2 | |
| North Carolina | 11.0 | 8.4 | ||
| North Dakota | 8.7 | 6.7 | ||
| Ohio | 10.7 | 7.7 | ||
| Oklahoma | 11.4 | 9.5 | ||
| Oregon | 10.0 | 8.4 | ||
| Pennsylvania | 9.9 | 7.9 | ||
| Puerto Rico | 13.1 | 11.8 | ||
| Rhode Island | 9.4 | 6.8 | ||
| South Carolina | 11.6 | 8.4 | ||
| South Dakota | 8.2 | 7.7 | ||
| Tennessee | 12.2 | 10.6 | ||
| Texas | 12.0 | 9.8 | ||
| Utah | 8.7 | 6.4 | ||
| Vermont | 7.6 | 5.8 | ||
| Virginia | 9.5 | 6.7 | ||
| Washington | 9.0 | 7.6 | ||
| West Virginia | 13.4 | 11.0 | ||
| Wisconsin | 7.4 | 6.3 | ||
| Wyoming | 7.9 | 7.2 |
Note: Percentages and rates are age-adjusted to the 2000 US Census standard population. Up arrows indicate percentage or rate higher than the US median. Down arrows indicate lower percentage or rate. An equal to symbol indicates the state percentage or rate is the same as the US median. N/A means not applicable.
Data sources: United States Diabetes Surveillance System and Behavioral Risk Factor Surveillance System, Centers for Disease Control and Prevention.
Figure 7 shows the trend in geographic distribution of diagnosed diabetes prevalence among adults across US counties in 2004, 2012, and 2019. In general, the largest percentages were in the southeastern and Appalachian portions of the United States. The median county-level prevalence of diagnosed diabetes increased from 6.3% in 2004 to 8.4% in 2019.10 County-level data can help researchers and public health officials, community organizations, health care professionals, and policy makers identify and work to reduce gaps in diabetes care at the local level.
Figure 7. County-Level Distribution of Diagnosed Diabetes Prevalence Among US Adults Aged 20 Years or Older, 2004, 2012, and 2019
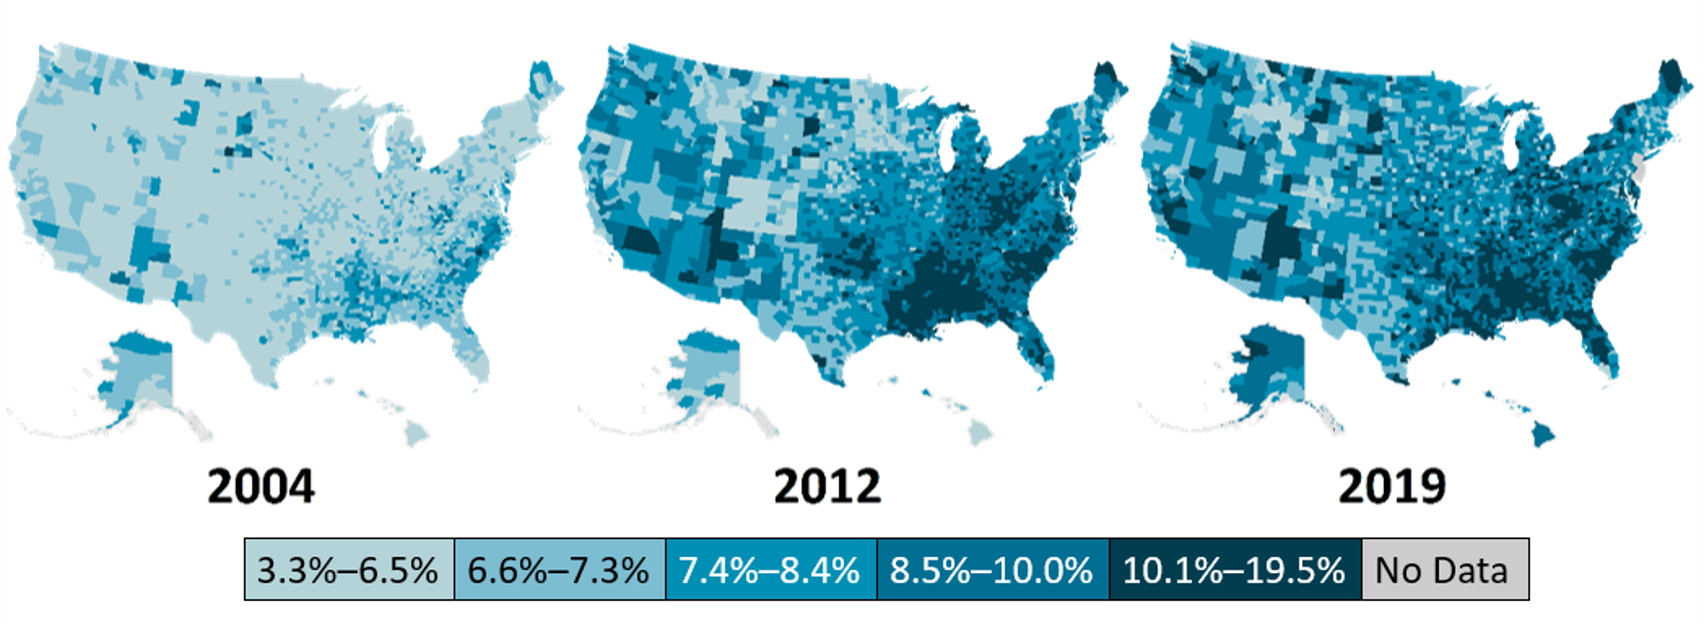
Notes: Percentages are age-adjusted to the 2000 US Census standard population using age groups 20–44, 45–64, and 65 or older. Maps include all 50 states and Puerto Rico. Figure adapted from CDC’s National Diabetes Statistics Report.
Data sources: United States Diabetes Surveillance System and Behavioral Risk Factor Surveillance System, Centers for Disease Control and Prevention.
For detailed data for each map, go to https://gis.cdc.gov/grasp/diabetes/DiabetesAtlas.html# . Click on the “County” tab in the panel on the left, then select “All Counties.” Click on the horizontal line below the map to see data for different years.