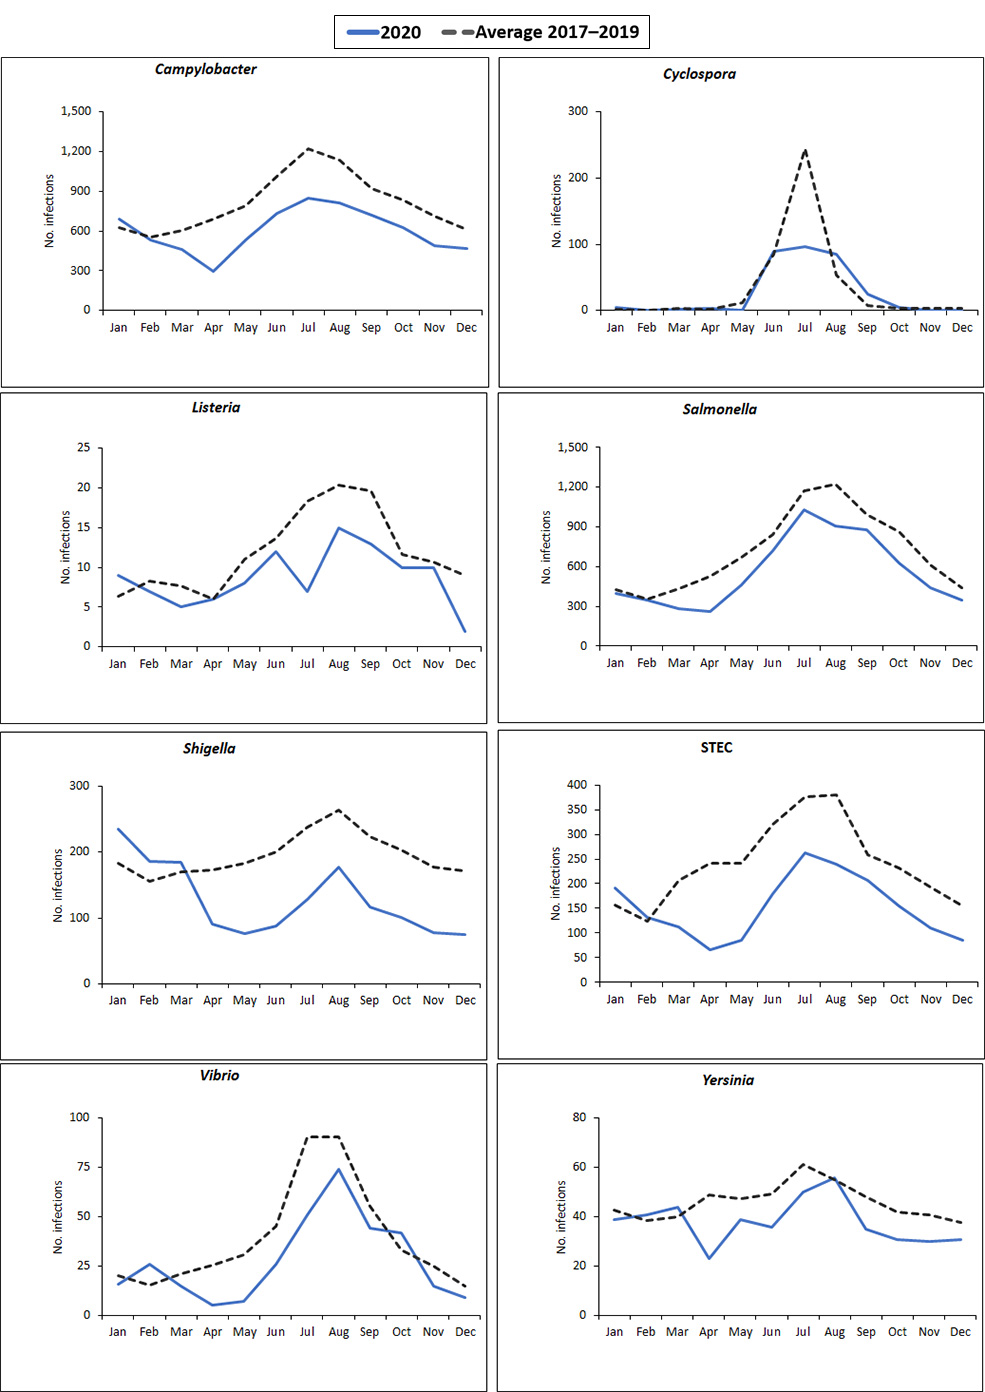
2020 Preliminary Data: Tables and Figure
Documenting the major sources of and trends in foodborne illness provides important information needed to determine whether prevention measures are working. Each year, FoodNet reports on the number of infections in the FoodNet surveillance area from pathogens transmitted commonly through food.
This year’s report summarizes 2020 preliminary surveillance data and describes 2020 incidence compared with the average incidence for 2017–2019 for infections caused by Campylobacter, Cyclospora, Listeria, Salmonella, Shiga toxin-producing Escherichia coli (STEC), Shigella, Vibrio, and Yersinia. The report also summarizes cases of hemolytic uremic syndrome (HUS) for 2019. Laboratory tests, including cultures and culture-independent diagnostic tests (CIDTs), detected these pathogens.
Incidence trends
FoodNet uses a main-effects, log-linear Poisson regression (negative binomial) model to estimate changes in the incidence of infection. The model adjusts for the increase in the number of FoodNet sites since 1996 and for variation in the incidence of infections among sites. The average annual incidence for 2017–2019 is used for comparisons. The model is used to calculate the estimated change in incidence (relative rate) between 2020 and the comparison periods, with 95% confidence intervals (CIs).
| Serotype | % Change in Incidence Rate† | (95% CI) |
|---|---|---|
| Enteritidis | -36% | (-45% to -26%) |
| Newport | +9% | (-10% to +32%) |
| Javiana | -31% | (-45% to -13%) |
| Typhimurium | -37% | (-45% to -28%) |
| I 4,[5],12:i:- | -48% | (-60% to -33%) |
| Hadar | +617% | (+382% to +967%) |
| Infantis | -15% | (-35% to +12%) |
*Data for 2020 are preliminary.
†Percentage change reported as increase (+) or decrease (-). Significant changes indicated in bold.
Serotypes listed in order of decreasing incidence, with the most prevalent serotype – Enteritidis – at the top.
| Serogroup | % Change in Incidence Rate† | (95% CI) |
|---|---|---|
| O157 | -37% | (-49% to -22%) |
| non-O157 | -43% | (-51% to -34%) |
*Data for 2020 are preliminary.
†Percentage change reported as increase (+) or decrease (-). Significant changes indicated in bold.
| Population | % Change in Incidence Rate† | (95% CI) |
|---|---|---|
| <18 years of age | -2% | (-27% to +32%) |
| <5 years of age | +14% | (-22% to +66%) |
*Data for 2019 are preliminary.
†Percentage change reported as increase (+) or decrease (-). Significant changes indicated in bold.

