Recommendations for Fully Vaccinated People
COVID-19 Homepage

The Unequal Toll of the COVID-19 Pandemic
The COVID-19 pandemic continues to deepen health disparities in our country. Long-standing inequalities have increased the risk for severe COVID-19 illnesses and death for many people. This both causes and continues disparities between racial and ethnic minority groups and non-Hispanic white people. Unequal health risks are the result of different conditions where people live, work, learn, play, and age—what we call social determinants of health.
By improving race and ethnicity data collection and reporting, we continue to increase our understanding of health disparities related to COVID-19. This knowledge helps us create more equitable public health policies and prevention strategies. Using multiple sources, CDC data show that the risks for COVID-19 illness, hospitalization, and death differ by race and ethnicity.
- American Indian and Alaska Native people were 3.7 times more likely than non-Hispanic white people to be hospitalized and 2.4 times more likely to die from COVID-19 infection.
- Black or African American people were 2.9 times more likely than non-Hispanic white people to be hospitalized and 1.9 times more likely to die from COVID-19 infection.
- Hispanic and Latino people were 3.1 times more likely than non-Hispanic white people to be hospitalized and 2.3 times more likely to die from COVID-19 infection.
Among people under the age of 25, a study released this week found that COVID-19 case incidence disparities were higher among most racial and ethnic minority groups, particularly earlier in 2020. To track disparities, CDC provides race and ethnicity data for cases and deaths, and vaccinations. New dashboards on COVID Data Tracker display changes in the impact of the pandemic over time by race and ethnicity.
Social determinants of health contribute to racial and ethnic minority groups being disproportionately affected by COVID-19. Discrimination, which includes racism and associated chronic stress, influences each of these social determinants as well. We all have a role to play and must work together to ensure that people have resources to maintain and manage their physical and mental health, including easy access to information, affordable testing, vaccinations, and medical care.
Reported Cases
From January 11 through February 26, the 7-day average of newly reported cases declined daily. From February 27 through March 1, 2021, the 7-day average increased daily; however, as of March 2, the 7-day average of new cases began to decline again. Since the highest 7-day average of 249,378 on January 11, 2021, the 7-day moving average decreased 78.1%. On March 10, there was a 11.2% decrease in the 7-day average number of daily cases reported compared with the prior week, which provides an encouraging sign of continued progress. Even with these declines, the 56,586 cases reported on March 10, 2021, is higher than the 42,597 cases reported during the first peak in the pandemic on April 6, 2020.
Jurisdictions have submitted historical corrections in the past 2 weeks, which influence the 7-day moving averages and percent change of the 7-day moving averages. Thus, the table below represents the new cases (not historical), the current and previous 7-day averages, and the percent change in the 7-day average with these historical data excluded. These historical corrections are included in the total cases below.
56,586
New Cases Reported*
56,586
New Cases Reported*
54,639
Current 7-Day Average**
54,639
Current 7-Day Average**
29,052,862
Total Cases Reported
29,052,862
Total Cases Reported
61,538
Prior 7-Day Average
61,538
Prior 7-Day Average
249,378
Peak of 7-Day Average***
249,378
Peak of 7-Day Average***
-11.2%
Change in 7-Day Average since Prior Week
-11.2%
Change in 7-Day Average since Prior Week
* New cases reported here may differ slightly from those on the COVID Data Tracker as new methods are being used to account for historical corrections.
** In the current week, 87,670 historical cases were excluded, and in the prior week, 8,585 historical cases were excluded.
***Highest peak for 7-day average (January 11, 2021).
Daily Trends in COVID-19 Cases in the United States Reported to CDC

7-Day moving average
SARS-CoV-2 Variants
CDC is closely tracking variants of SARS-CoV-2, the virus that causes COVID-19. Three variants of concern have been detected in the United States: B.1.1.7, B.1.351, and P.1. A total of 3,701 B.1.1.7 variant cases have been reported in 50 jurisdictions. One hundred eight cases attributed to B.1.351 in 23 jurisdictions and 17 cases attributed to P.1 in 10 jurisdictions have also been detected in the United States. CDC and partners are increasing the numbers of specimens sequenced in laboratories around the country. The number of variants reported will likely increase as more specimens are sequenced and if the frequency of variants increases. Studies are underway to determine whether variants are more transmissible, cause more severe illness, or are likely to evade immunity brought on by prior illness or vaccination.
Variant
Variant
Variant
Reported Cases in US
Reported Cases in US
Reported Cases in US
Number of Jurisdictions with ≥1 Case Reported
Number of Jurisdictions with ≥1 Case Reported
Number of Jurisdictions with ≥1 Case Reported
B.1.1.7
Variant
B.1.1.7
3,701
Reported Cases in US
3,701
50
Number of Jurisdictions with ≥1 Case Reported
50
B.1.351
Variant
B.1.351
108
Reported Cases in US
108
23
Number of Jurisdictions with ≥1 Case Reported
23
P.1
Variant
P.1
17
Reported Cases in US
17
10
Number of Jurisdictions with ≥1 Case Reported
10
Testing
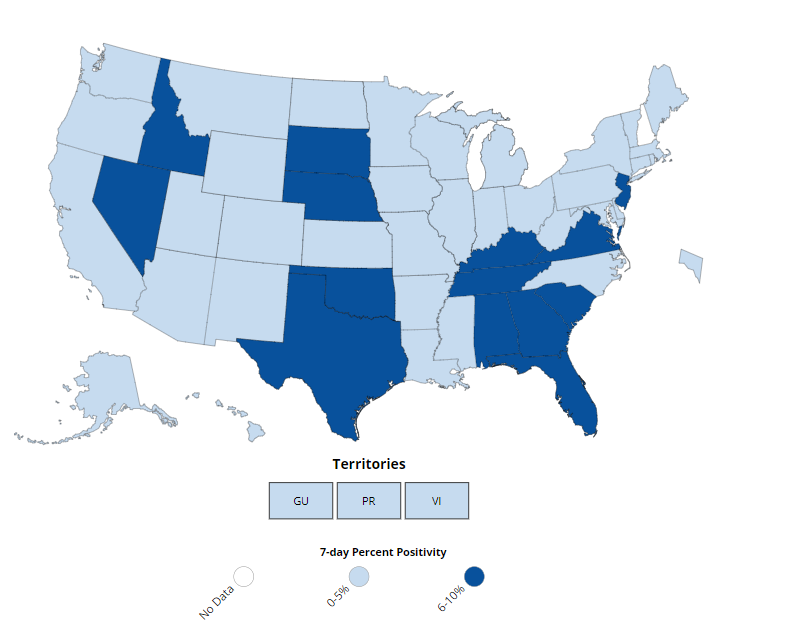
The percent of COVID-19 RT-PCR tests that are positive (percent positivity) continues to decline. The 7-day average of percent positivity from tests is now 4.1%. The 7-day average test volume for March 5-March 11, 2021, was 1,201,691, down 2.7% from 1,235,406 for the prior 7 days.
345,686,141
Total Tests Reported
345,686,141
Total Tests Reported
1,201,691
7-Day Average Test Volume
1,201,691
7-Day Average Test Volume
4.1%
7-Day Average
% Positivity
4.1%
7-Day Average
% Positivity
-11.1%
Change in 7-Day
% Positivity
-11.1%
Change in 7-Day
% Positivity
COVID-19 Viral (RT-PCR) Laboratory Test 7-day Percent Positivity by State/Territory
Vaccinations
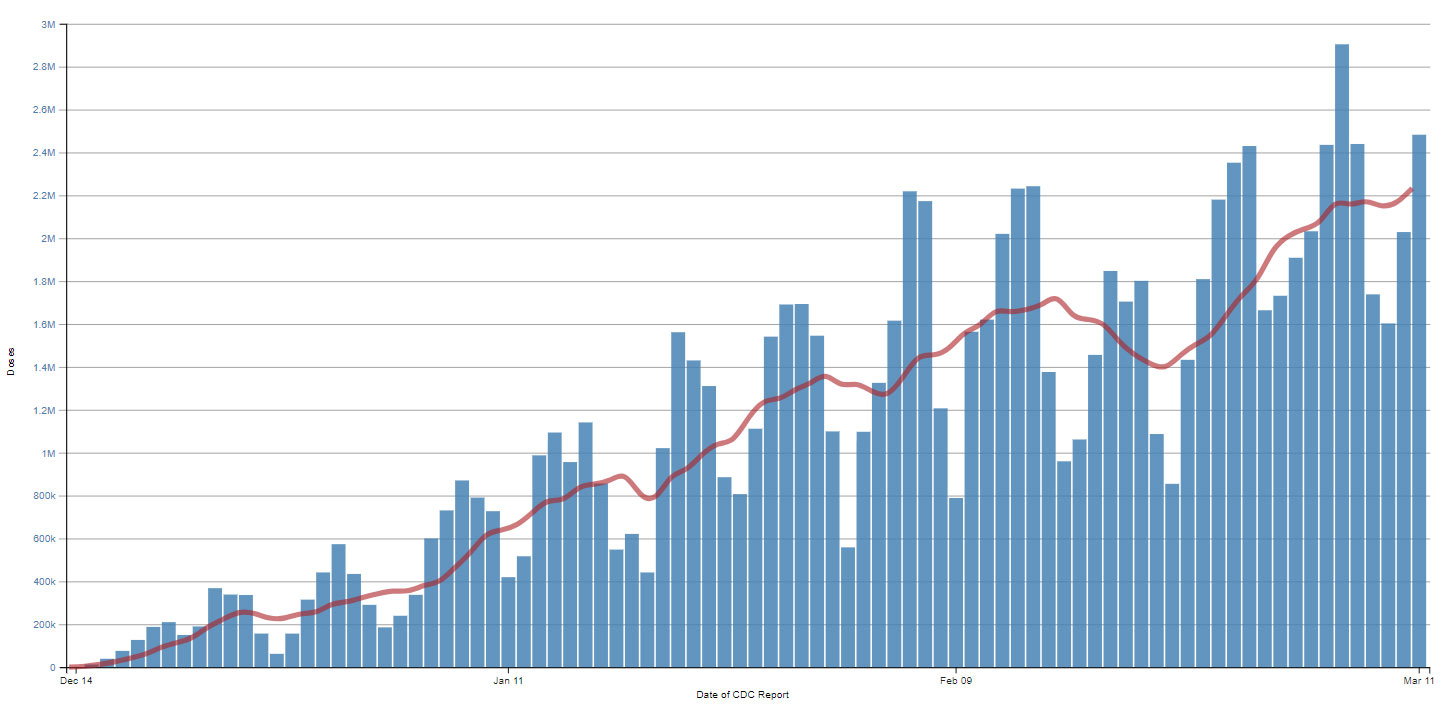
The U.S. COVID-19 Vaccination Program began December 14. As of March 10, 2021, 95.7 million vaccine doses have been administered. Overall, about 62.5 million people, or 18.8% of the U.S. population, have received at least one dose of vaccine. About 32.9 million people, or 9.9% of the U.S. population have been fully vaccinated.* As of March 10, the 7-day average number of administered vaccine doses reported to CDC per day was 2.2 million, an 8% increase from the previous week. Data by type of vaccine, which now includes the J&J/Janssen vaccine, are available on CDC’s COVID Data Tracker.
95,721,290
Vaccines Administered
95,721,290
Vaccines Administered
62,451,150
People who received at least one dose
62,451,150
People who received at least one dose
32,904,161
People who are fully vaccinated*
32,904,161
People who are fully vaccinated*
*People who are fully vaccinated (formerly “receiving 2 doses”) represents the number of people who have received the second dose in a two-dose COVID-19 vaccine series or one dose of the single-shot J&J/Janssen COVID-19 vaccine.
Daily Change in Number of COVID-19 Vaccinations in the United States Reported to CDC

7-Day moving average
New Hospital Admissions
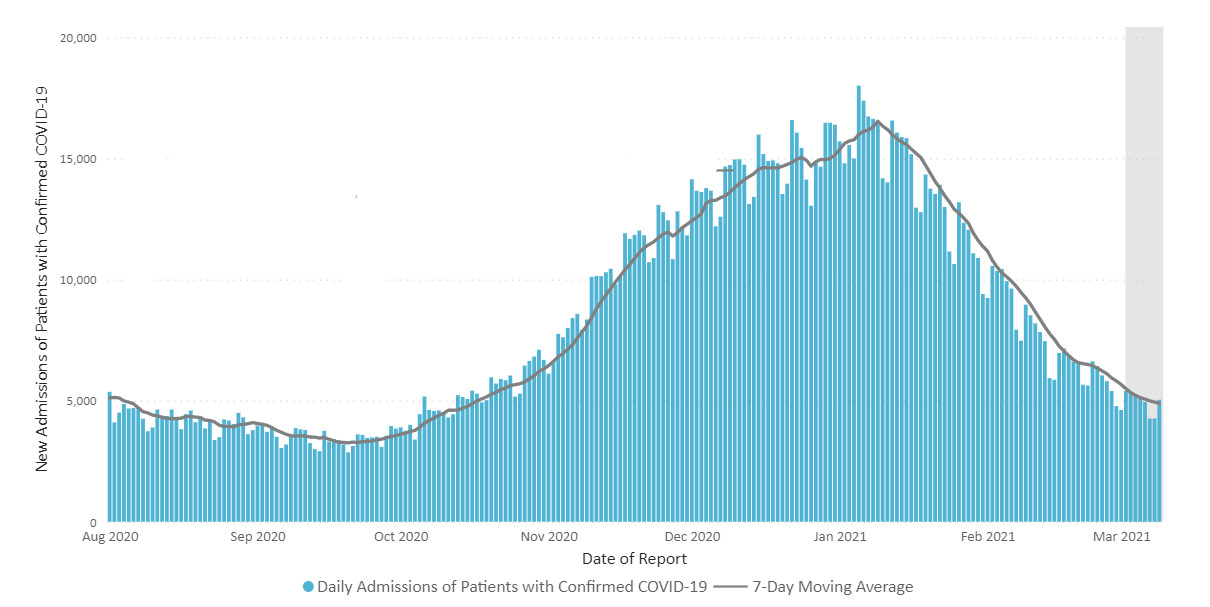
Hospital admissions of patients with confirmed COVID-19 decreased 70.4% from the national 7-day average peak of 16,540 admissions on January 9, 2021, to 4,889 admissions over the week ending March 9, 2021. The average number of daily admissions fell by 11%, compared to the previous week.
5,035
New Admissions
5,035
New Admissions
4,889
Current 7-Day Average
4,889
Current 7-Day Average
1,848,853
Total New Admissions
1,848,853
Total New Admissions
5,494
Prior 7-Day Average
5,494
Prior 7-Day Average
16,540
Peak 7-Day Average
16,540
Peak 7-Day Average
-11%
Change in 7-Day Average
-11%
Change in 7-Day Average
Daily Trends in Number of New COVID-19 Hospital Admissions in the United States

The most recent data in the vertical gray bar are provisional and should be interpreted with caution.
Deaths
In recent weeks, the number of COVID-19 deaths has fluctuated. However, there has been an overall decline of 56.6% of the 7-day moving average since January 13, 2021. As of March 10, 2021, a total of 527,726 COVID-19 deaths were reported. The current 7-day average of deaths is 1,465, a 19.3% decrease from the previous 7-day average of 1,816 daily deaths.
Jurisdictions have submitted several historical corrections in the past 2 weeks, which affect the 7-day moving averages and percent change of the 7-day moving averages. Thus, the table below represents the new deaths (not historical), the current and previous 7-day averages, and the percent change in the 7-day average with these historical data excluded. These historical corrections are included in the total deaths below.
1,513
New Deaths Reported*
1,513
New Deaths Reported*
1,465
Current 7-Day Average**
1,465
Current 7-Day Average**
527,726
Total Deaths Reported
527,726
Total Deaths Reported
1,816
Prior 7-Day Average
1,816
Prior 7-Day Average
3,378
Peak of 7-day Average***
3,378
Peak of 7-day Average***
-19.3%
change in the 7-Day Average Since the Prior Week
-19.3%
change in the 7-Day Average Since the Prior Week
* New deaths reported here may differ slightly from those on the COVID Data Tracker as new methods are being used to account for historical corrections.
** In the current week, there were 138 historical deaths excluded, and in the prior week, there were 806 historical deaths excluded.
*** The highest peak in the 7-day average of new deaths (Jan 11, 2021).
Daily Trends in Number of COVID-19 Deaths in the United States Reported to CDC

7-Day moving average
The Coronavirus Disease 2019 (COVID-19)-Associated Hospitalization Surveillance Network (COVID-NET) is an additional source for hospitalization data collected through a network of more than 250 acute-care hospitals in 14 states (representing ~10% of the U.S. population). Detailed data on patient demographics, including race/ethnicity, underlying medical conditions, medical interventions, and clinical outcomes, are collected using a standardized case reporting form.
CDC’s website also provides new data views such as county-specific summaries (under “Your Community” in Data Tracker), vaccination trends (under “Your Community” in Data Tracker), and information on SARS-CoV-2 variants.


