Recommendations for Fully Vaccinated People
COVID-19 Homepage

Health Equity and Disability
Interpretive Summary for October 8, 2021
Health Equity and Disability
COVID-19 cases, hospitalizations, and deaths are once again declining in many parts of the country. Sadly, the United States reached a grim milestone this week, surpassing 700,000 total deaths from COVID-19. Studies have shown that COVID-19 does not affect all population groups equally. Some people with disabilities might be more likely to get infected or have severe outcomes from COVID-19 because of underlying medical conditions, group living settings, or systemic health and social inequities.
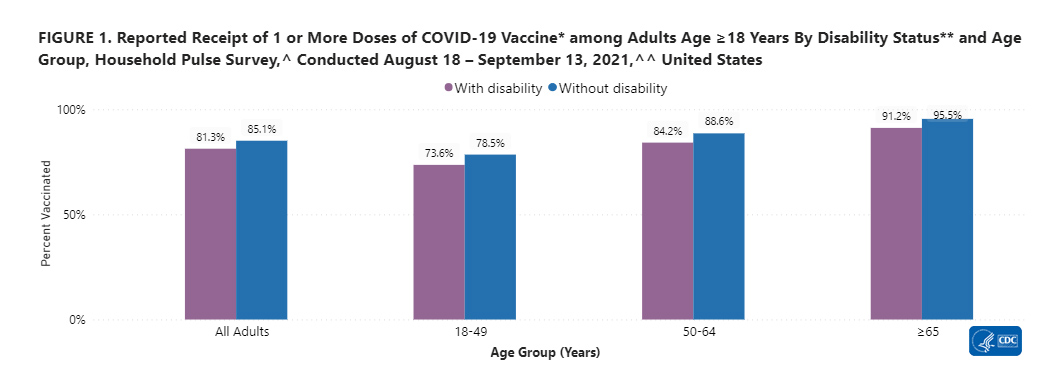
It is important that all people, including people with disabilities and people who provide support to people with disabilities, get a COVID-19 vaccine. Many people with disabilities face significant challenges accessing COVID-19 vaccination services and may need support. A recent analysis of CDC survey data shows that some adults with a disability* were more likely to report difficulty getting a COVID-19 vaccine compared to adults without a disability. Despite disparities related to COVID-19 vaccine access, adults with a disability are less likely to report being hesitant about vaccination compared to adults without a disability.
People with disabilities need health care and health programs for the same reasons anyone else does—to stay well and active. Good health is important to be able to work, learn, and be engaged within a community. CDC has resources to support people with disabilities and those who care for them. CDC’s Toolkit for People with Disabilities includes guides for increasing disabled persons’ access to vaccinations along with COVID-19 FAQs. To find a vaccine provider near you, visit Vaccines.gov or your state or local public health department website.
*In assessing COVID-19 vaccination status for this analysis, CDC asked “Do you have serious difficulty seeing, hearing, walking, remembering, making decisions, or communicating?” Respondents who answered “yes” were considered to have a disability, and those who answered “no” were categorized as having no disability.
Note to readers: CDC’s COVID Data Tracker’s Health Equity Data page catalogs current health equity-related data on the COVID Data Tracker that align with populations and place-based focus groups identified in the CDC COVID-19 Response Health Equity Strategy Pdf[86 KB, 5 Pages]. On this page, users can find data on COVID-19 vaccination among people with disabilities, underlying medical conditions, COVID-19 vaccination equity, and more.
Reported Cases
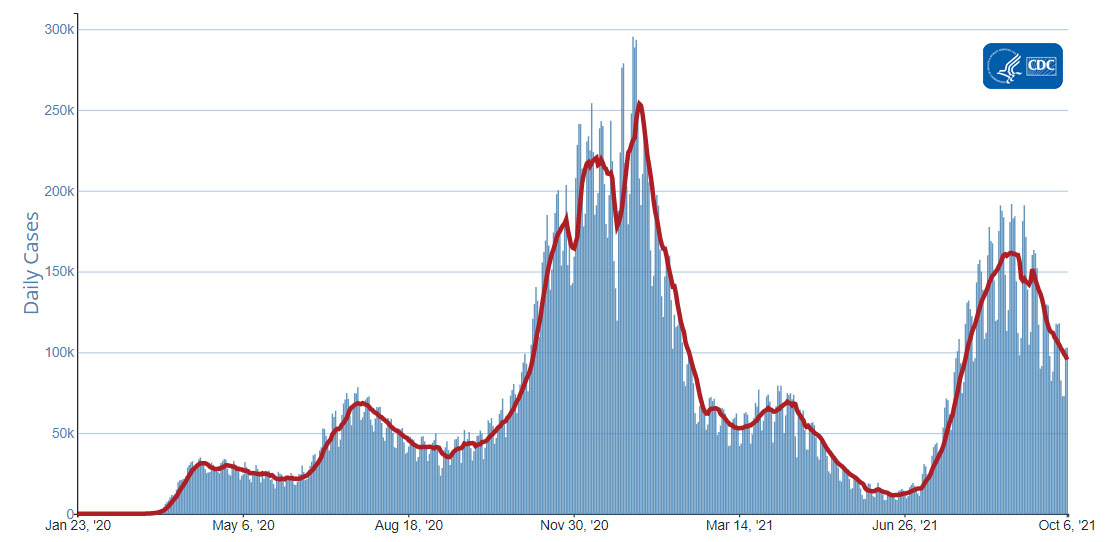
The current 7-day moving average of daily new cases (95,448) decreased 11.6% compared with the previous 7-day moving average (107,953). A total of 43,997,504 COVID-19 cases have been reported as of October 6, 2021.
43,997,504
Total Cases Reported
43,997,504
Total Cases Reported
95,448
Current 7-Day Average*
95,448
Current 7-Day Average*
107,953
Prior 7-Day Average
107,953
Prior 7-Day Average
-11.6%
Change in 7-Day Average since Prior Week
-11.6%
Change in 7-Day Average since Prior Week
*Historical cases are excluded from daily new cases and 7-day average calculations until they are incorporated into the dataset for the applicable date. Of 120,872 historical cases reported retroactively, 14,358 were reported in the current week and 6,168 were reported in the prior week.
Daily Trends in COVID-19 Cases in the United States Reported to CDC

7-Day moving average
SARS-CoV-2 Variants
Currently, the Delta variant is the only variant classified as a Variant of Concern (VOC) in the United States. There are no variants classified as a Variant of Interest (VOI) and there are 10 variants classified as Variants Being Monitored (VBM). VBM do not pose a significant and imminent risk to public health in the United States due to their very low prevalence, which is currently estimated to be less than 0.1%.
Nowcast projections* for the week ending October 2, 2021, estimate the national proportion of the Delta variant to be greater than 99%. Nowcast estimates indicate that Delta will continue to be the predominant variant circulating in all 10 U.S. Department of Health and Human Services (HHS) regions, circulating at greater than 99%.
*The median time from specimen collection to sequence data reporting is about 3 weeks. As a result, weighted estimates for the most recent few weeks may be unstable or unavailable. CDC’s Nowcast is a data projection tool that helps fill this gap by generating timely estimates of variant proportions for variants that are circulating in the United States. View Nowcast estimates on CDC’s COVID Data Tracker website on the Variant Proportions page.
Testing
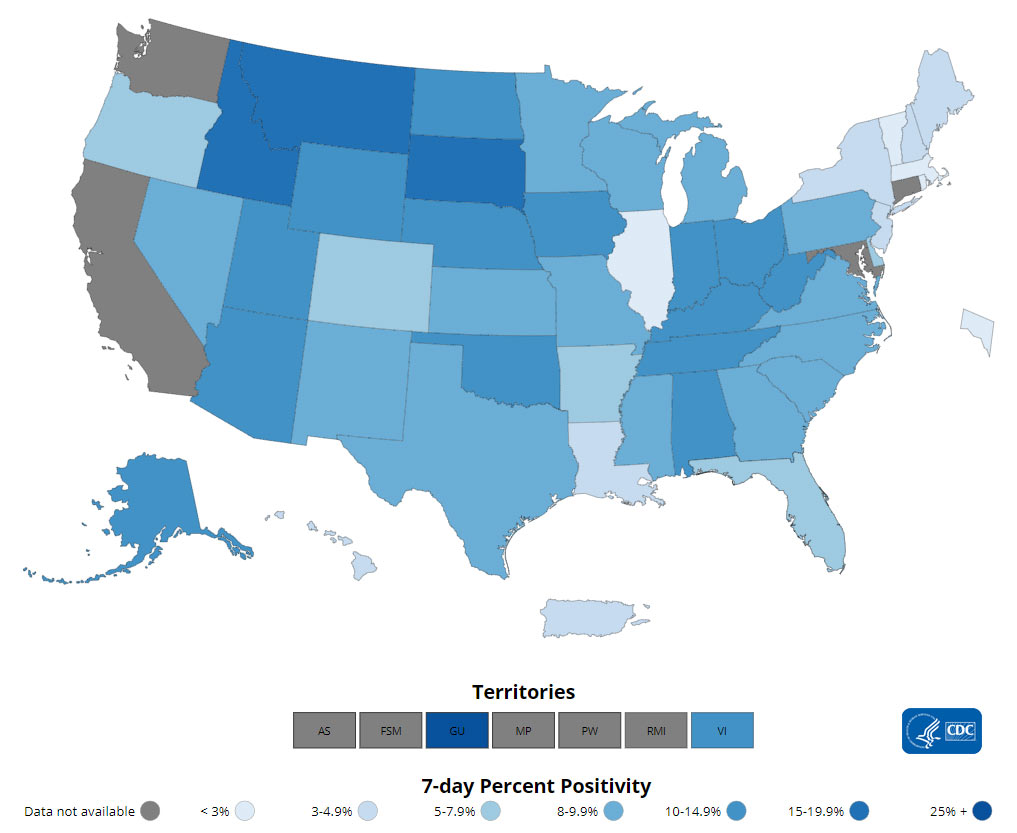
The percentage of COVID-19 NAATs (nucleic acid amplification tests)* that are positive (percent positivityExternal) has decreased from the previous week. The 7-day average of percent positivity from NAATs is now 6.1%. The 7-day average number of tests reported for September 24 – September 30, 2021, was 1,536,250, down 6.0% from 1,634,837 for the prior 7 days.
586,818,195
Total Tests Reported
586,818,195
Total Tests Reported
1,536,250
7-Day Average Tests Reported
1,536,250
7-Day Average Tests Reported
6.1%
7-Day Average % Positivity
6.1%
7-Day Average % Positivity
6.5%
Previous 7-Day Average % Positivity
6.5%
Previous 7-Day Average % Positivity
-5.9%
Change in 7-Day Average % Positivity since Prior Week
-5.9%
Change in 7-Day Average % Positivity since Prior Week
*Test for SARS-CoV-2, the virus that causes COVID-19
COVID-19 NAAT Laboratory Test 7-day Percent Positivity by State/Territory
Vaccinations
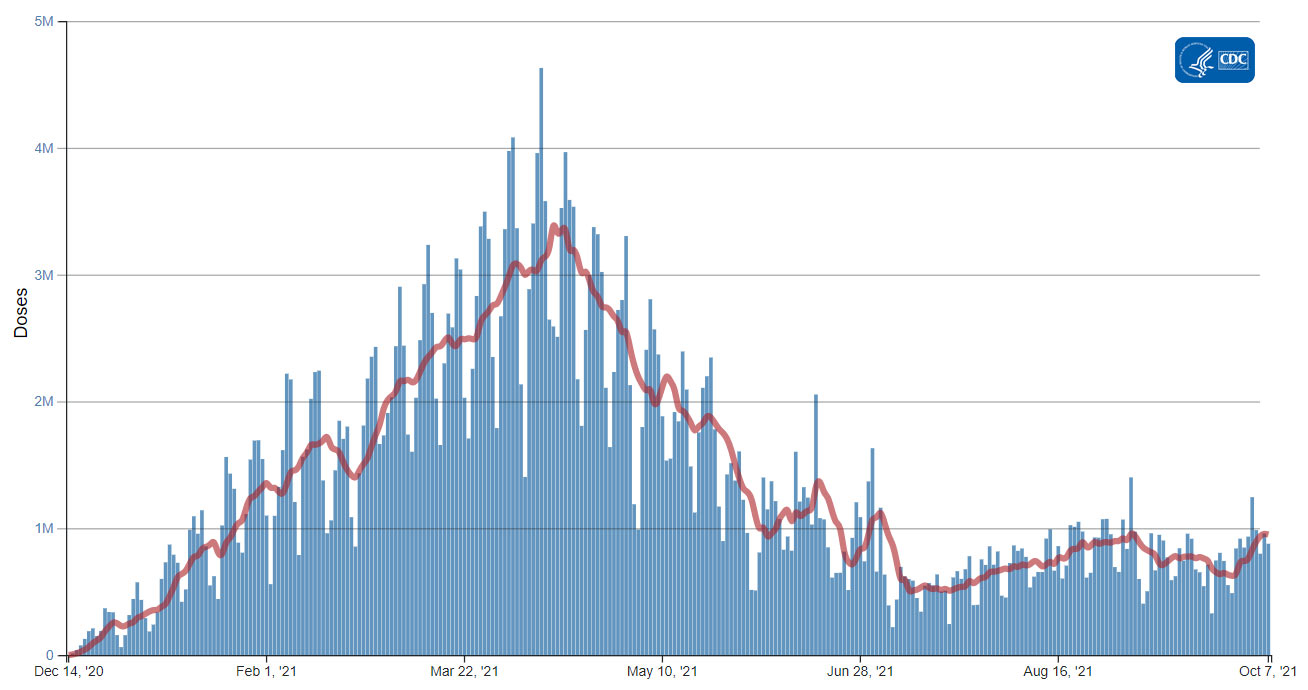
The U.S. COVID-19 Vaccination Program began December 14, 2020. As of October 7, 2021, 399.6 million vaccine doses have been administered. Overall, about 216.3 million people, or 65.1% of the total U.S. population, have received at least one dose of vaccine. About 186.6 million people, or 56.2% of the total U.S. population, have been fully vaccinated.* About 6.4 million additional/booster doses in fully vaccinated people have been reported. As of October 7, 2021, the 7-day average number of administered vaccine doses reported (by date of CDC report) to CDC per day was 948,921, a 30.5% increase from the previous week.
CDC’s COVID Data Tracker Vaccination Demographic Trends tab shows vaccination trends by age group. As of October 7, 2021, 94.7% of people ages 65 years or older have received at least one dose of vaccine and 83.8% are fully vaccinated. More than three-quarters (78%) of people ages 18 years or older have received at least one dose of vaccine and 67.6% are fully vaccinated. For people ages 12 years or older, 76.2% have received at least one dose of vaccine and 65.8% are fully vaccinated.
399,552,444
Vaccines Administered
399,552,444
Vaccines Administered
216,268,034
People who received at least one dose
216,268,034
People who received at least one dose
186,618,184
People who are fully vaccinated*
186,618,184
People who are fully vaccinated*
65.1%
Percentage of the US population that has received at least one dose
65.1%
Percentage of the US population that has received at least one dose
56.2%
Percentage of the US population that has been fully vaccinated*
56.2%
Percentage of the US population that has been fully vaccinated*
+0.5
Percentage point increase from last week
+0.5
Percentage point increase from last week
+0.6
Percentage point increase from last week
+0.6
Percentage point increase from last week
*Represents the number of people who have received the second dose in a two-dose COVID-19 vaccine series (such as the Pfizer or Moderna vaccines) or one dose of the single-shot Johnson & Johnson’s Janssen vaccine.
Daily Change in the Total Number of Administered COVID-19 Vaccine Doses Reported to CDC by the Date of CDC Report, United States

7-Day moving average
Hospitalizations
New Hospital Admissions
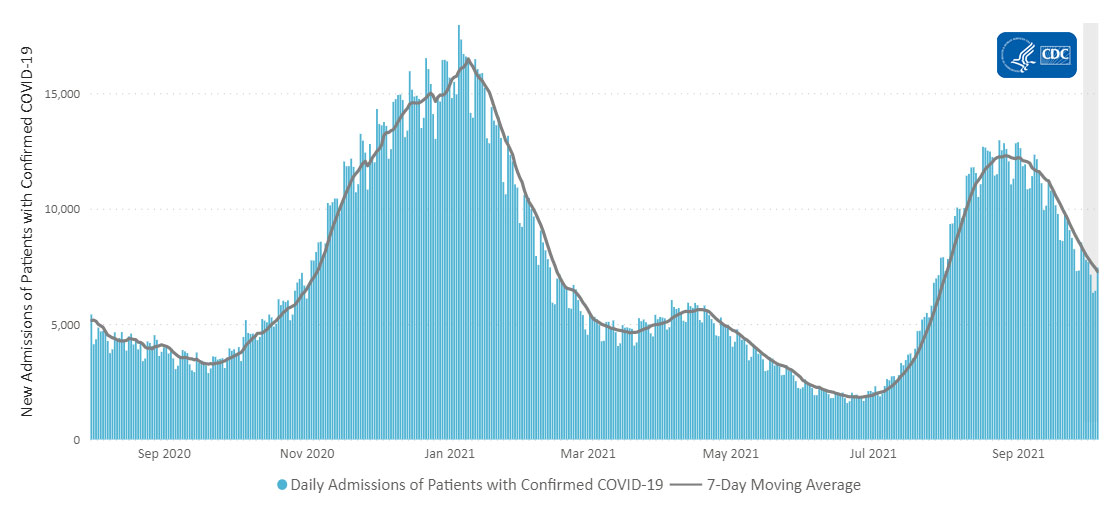
The current 7-day daily average for September 29–October 5, 2021, was 7,440. This is a 13.2% decrease from the prior 7-day average (8,378) from September 22–September 28, 2021.
3,096,659
Total New Admissions
3,096,659
Total New Admissions
7,440
Current 7-Day Average
7,440
Current 7-Day Average
8,378
Prior 7-Day Average
8,378
Prior 7-Day Average
-13.2%
Change in 7-Day Average
-13.2%
Change in 7-Day Average
The start of consistent reporting of hospital admissions data was August 1, 2020.
Daily Trends in Number of New COVID-19 Hospital Admissions in the United States
New admissions are pulled from a 10 am EST snapshot of the HHS Unified Hospital Timeseries Dataset. Due to potential reporting delays, data from the most recent 7 days, as noted in the figure above with the grey bar, should be interpreted with caution. Small shifts in historic data may also occur due to changes in the Centers for Medicare and Medicaid Services (CMS) Provider of Services file, which is used to identify the cohort of included hospitals.
COVID-NET: Trends in Hospitalization Rates in Adults
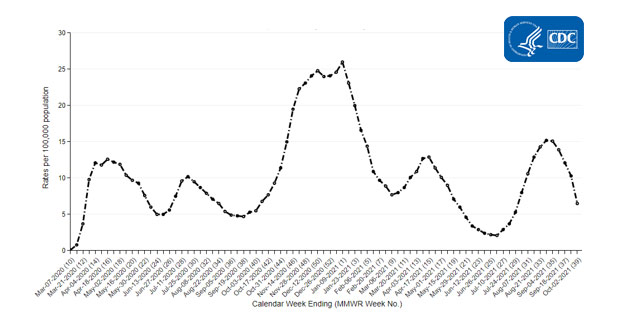
CDC’s Coronavirus Disease 2019-Associated Hospitalization Surveillance Network (COVID-NET) shows that rates of COVID-19-associated hospitalizations in adults ages 18 years and older have been declining in recent weeks. Rates of COVID-19-associated hospitalizations for adults peaked at 15.2 per 100,000 people in late August. Since then, preliminary data show that rates of COVID-19-associated hospitalizations in this group have fallen to 12.1 per 100,000 for the week ending September 18, 2021.
Trends in Hospitalization Rates in Adults
The Coronavirus Disease 2019 (COVID-19)-Associated Hospitalization Surveillance Network (COVID-NET) is an additional source for hospitalization data collected through a network of more than 250 acute-care hospitals in 14 states (representing ~10% of the U.S. population). Detailed data on patient demographics, including race/ethnicity, underlying medical conditions, medical interventions, and clinical outcomes, are standardized case reporting form.
Deaths
The current 7-day moving average of new deaths (1,431) has decreased 8.4% compared with the previous 7-day moving average (1,563). As of October 6, 2021, a total of 707,065 COVID-19 deaths have been reported in the United States.
707,065
Total Deaths Reported
707,065
Total Deaths Reported
1,431
Current 7-Day Average*
1,431
Current 7-Day Average*
1,563
Prior 7-Day Average
1,563
Prior 7-Day Average
-8.4%
Change in 7-Day Average Since Prior Week
-8.4%
Change in 7-Day Average Since Prior Week
*Historical deaths are excluded from the daily new deaths and 7-day average calculations until they are incorporated into the dataset by their applicable date. Of 8,784 historical deaths reported retroactively, 216 were reported in the current week; and 631 were reported in the prior week.
Daily Trends in Number of COVID-19 Deaths in the United States Reported to CDC

7-Day moving average
- National and State Trends in Anxiety and Depression Severity Scores Among Adults During the COVID-19 Pandemic — United States, 2020–2021
- Multicomponent Strategies to Prevent SARS-CoV-2 Transmission — Nine Overnight Youth Summer Camps, United States, June–August 2021
- COVID-19 Outbreaks at Youth Summer Camps — Louisiana, June–July 2021
- Disparities in COVID-19 Vaccination Status, Intent, and Perceived Access for Noninstitutionalized Adults, by Disability Status — National Immunization Survey Adult COVID Module, United States, May 30–June 26, 2021
- Distribution of SARS-CoV-2 Variants in a Large Integrated Health Care System — California, March–July 2021
Recent COVID Data Tracker Updates
- COVID-19 vaccine booster dose data is now available for download on the Vaccinations in the US tab
- A new Vaccine Effectiveness tab shows vaccine effectiveness against hospitalizations and infections
- The Vaccinations in the US tab now displays the number and percent of booster doses by certain age groupings (Total, 18+, 50+, and 65+), and the number of people with a booster dose by vaccine type
- The COVID Data Tracker homepage stats bar now shows the percent of the 12+ population with at least one dose of a COVID-19 vaccine
