Data Brief: Healthcare Utilization for Vaso-occlusive Episodes by People with Sickle Cell Disease in California and Georgia, 2015
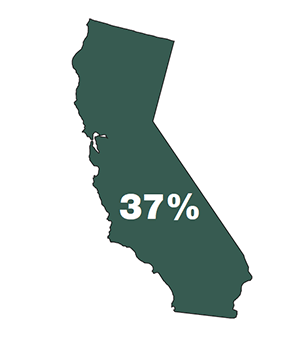
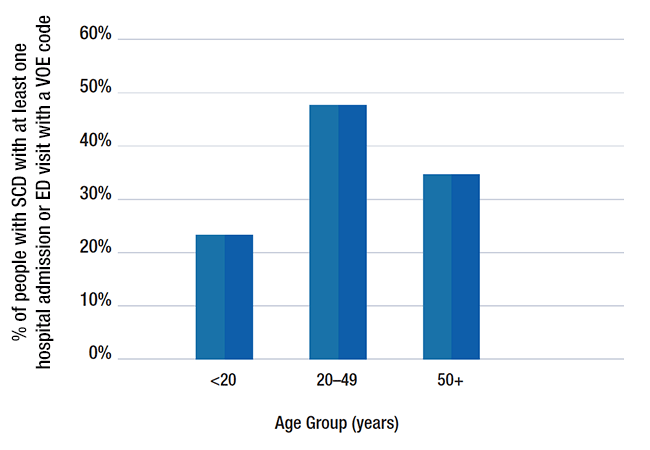
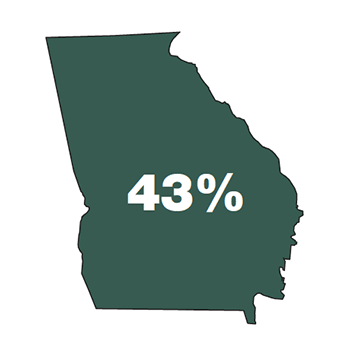
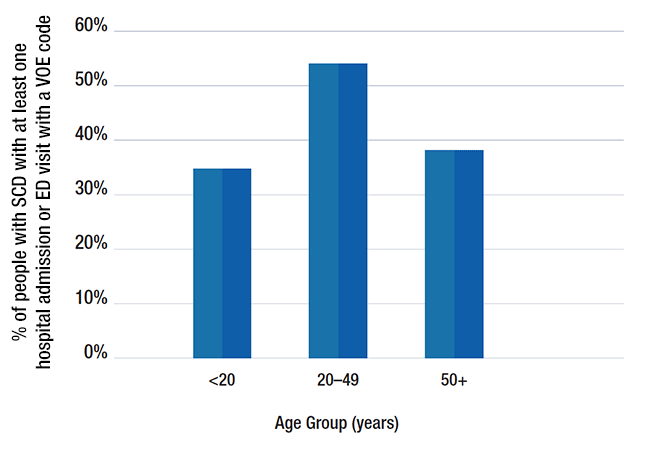
| Age Group (years) | California | Georgia |
|---|---|---|
| < 20 yrs | 23% | 33% |
| 20-49 yrs | 47% | 54% |
| 50+ yrs | 33% | 37% |
- Emergency department (ED) visits: ED visits that resulted in a release after treatment
- Hospital admissions: Direct hospital admissions, as well as hospital admissions that began in the ED
Go to the hospital more than once a year, with an average stay of 5 days per hospitalization.
Go to the ED an average of 2–3 times a year.
Go to the ED and hospital most commonly for VOEs.
A large number of hospitalizations and ED visits for people with SCD had a VOE diagnosis code.
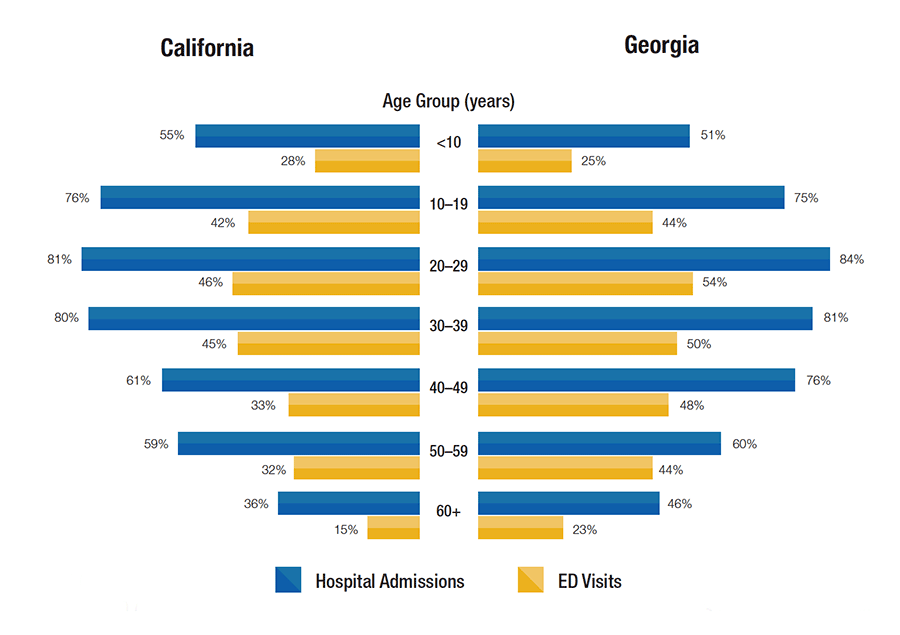
| Age Group (years) | ED visits | Hospital Admissions |
|---|---|---|
| <10 | 28% | 55% |
| 10–19 | 42% | 76% |
| 20–29 | 46% | 81% |
| 30–39 | 45% | 80% |
| 40–49 | 33% | 61% |
| 50–59 | 32% | 59% |
| 60+ | 15% | 36% |
| Age Group (years) | ED visits | Hospital Admissions |
|---|---|---|
| <10 | 25% | 51% |
| 10–19 | 44% | 75% |
| 20–29 | 54% | 84% |
| 30–39 | 50% | 81% |
| 40–49 | 48% | 76% |
| 50–59 | 44% | 60% |
| 60+ | 23% | 46% |
More than 4 in 10 (41%) ED visits and more than 7 in 10 (73%) hospital admissions for people with SCD in California had a VOE diagnosis code.
Nearly 1 in 2 (48%) ED visits and 3 in 4 (75%) hospital admissions for people with SCD in Georgia had a VOE diagnosis code.
CDC’s Sickle Cell Data Collection (SCDC)
This program collects and analyzes data to better understand how people with sickle cell disease (SCD) are accessing and using health care. These data are used to target and develop strategies to improve access to the healthcare system and, ultimately, to improve the health of people living with SCD.
