Uncontrolled Asthma Among Children With Current Asthma, 2018–2020
Forty-four percent of children with current asthma had uncontrolled asthma
Children with well controlled asthma symptoms can lead normal lives. However, uncontrolled asthma with frequent and intense episodes of symptoms can have a significant cost to families and society because it may lead to an increased risk of an emergency department visit, hospitalization, and work and school absenteeism. Asthma control was classified as well controlled or uncontrolled based on the national asthma guidelines. *
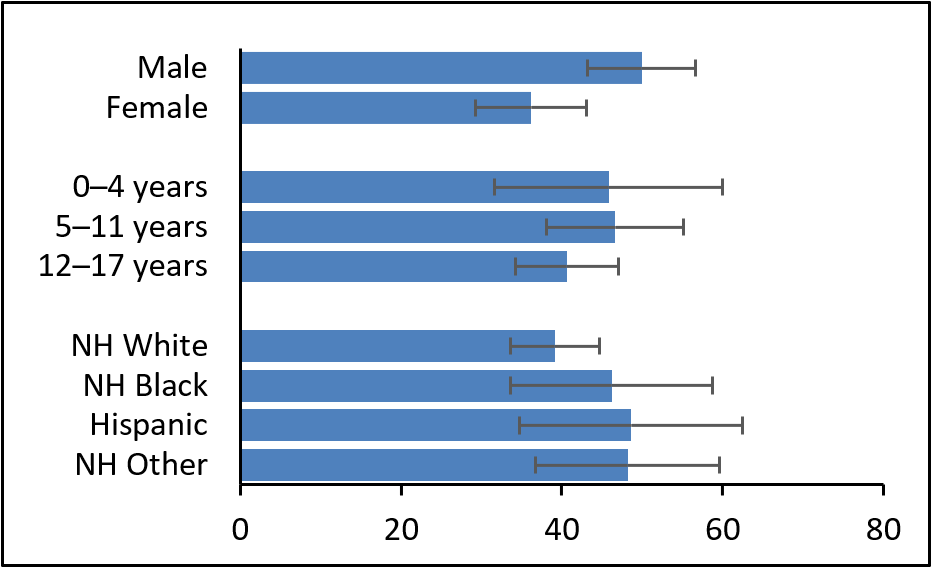
About 44.0% of children with current asthma† had uncontrolled asthma. The percentage with uncontrolled asthma was higher among boys (49.9%) than among girls (36.2%) (sex at birth). No other statistically significant differences by demographic characteristics were observed. The level of asthma control varies by state but does not seem to follow a specific geographic pattern. The percentage with uncontrolled asthma for children ranged from 32.3% in Indiana to 62.1% in New York (Table).
Abbreviation: NH, Non-Hispanic; SE, Standard error; CI, confidence interval
| Characteristic | Percent | 95% CI | SE | y-error bar (=1.96*SE) |
|---|---|---|---|---|
| Male | 49.9 | 43.2–56.5 | 2.42 | 6.7 |
| Female | 36.2 | 29.6–43.4 | 3.53 | 6.9 |
| 0–4 years | 45.8 | 32.3–60.0 | 7.24 | 14.2 |
| 5–11 years | 46.6 | 38.2–55.1 | 4.36 | 8.5 |
| 12–17 years | 40.6 | 34.5–47.1 | 3.26 | 6.4 |
| NH White | 39.1 | 33.7–44.8 | 1.51 | 5.5 |
| NH Black | 46.2 | 34.1–58.7 | 4.42 | 12.6 |
| Hispanic | 48.6 | 35.1–62.2 | 3.32 | 13.9 |
| NH Other | 48.2 | 37.1–59.6 | 4.36 | 11.4 |
| Children With Current† and Uncontrolled Asthma* | |||
|---|---|---|---|
| STATE§ | % | 95% CI | SE |
| Total¶ | 44.0 | 38.9–49.2 | 2.63 |
| CA | 37.9 | 24.5–53.4 | 7.57 |
| CT | 37.7 | 27.1–49.7 | 5.85 |
| FL | 42.0 | 28.3–56.6 | 7.27 |
| GA | 60.3 | 43.5–74.9 | 8.25 |
| HI | 33.5 | 21.0–48.9 | 7.25 |
| IN | 32.3 | 22.2–44.4 | 5.74 |
| KS | 52.9 | 42.0–63.5 | 5.57 |
| ME | 49.5 | 37.2–61.8 | 6.39 |
| MI | 47.8 | 39.0–56.8 | 4.56 |
| MN | 38.7 | 29.6–48.7 | 4.91 |
| MO | 47.9 | 33.2–63.0 | 7.82 |
| MT | 37.4 | 23.4–54.0 | 8.03 |
| NE | 42.4 | 29.7–56.2 | 6.93 |
| NM | 37.0 | 23.5–52.9 | 7.71 |
| NY | 62.1 | 44.1–77.2 | 8.74 |
| OH | 37.8 | 26.4–50.7 | 6.33 |
| PA | 36.3 | 23.0–52.2 | 7.63 |
| RI | 40.7 | 25.4–58.1 | 8.63 |
| UT | 54.5 | 44.7–63.9 | 4.94 |
| VT | 53.7 | 41.4–65.6 | 6.28 |
| WI | 36.4 | 23.7–51.3 | 7.18 |
Source: Behavioral Risk Factors Surveillance System (BRFSS)—Child Asthma Call-back Survey Data, 2018-2020
*National Asthma Education and Prevention Program Expert panel report 3: Guidelines for the Diagnosis and Management of Asthma, 2007. Available at: https://www.ncbi.nlm.nih.gov/books/NBK7232/pdf/Bookshelf_NBK7232.pdf [PDF – 3.9 MB].
†Includes persons who answered “yes” to the questions: “Have you ever been told by a doctor, nurse, or other health professional that you had asthma?” and “Do you still have asthma?”
§Includes states with 3 years of data.
¶Total includes the 21 listed states.