Usual Place for Medical Care Among U.S. Children by Asthma Status, 2019–2020
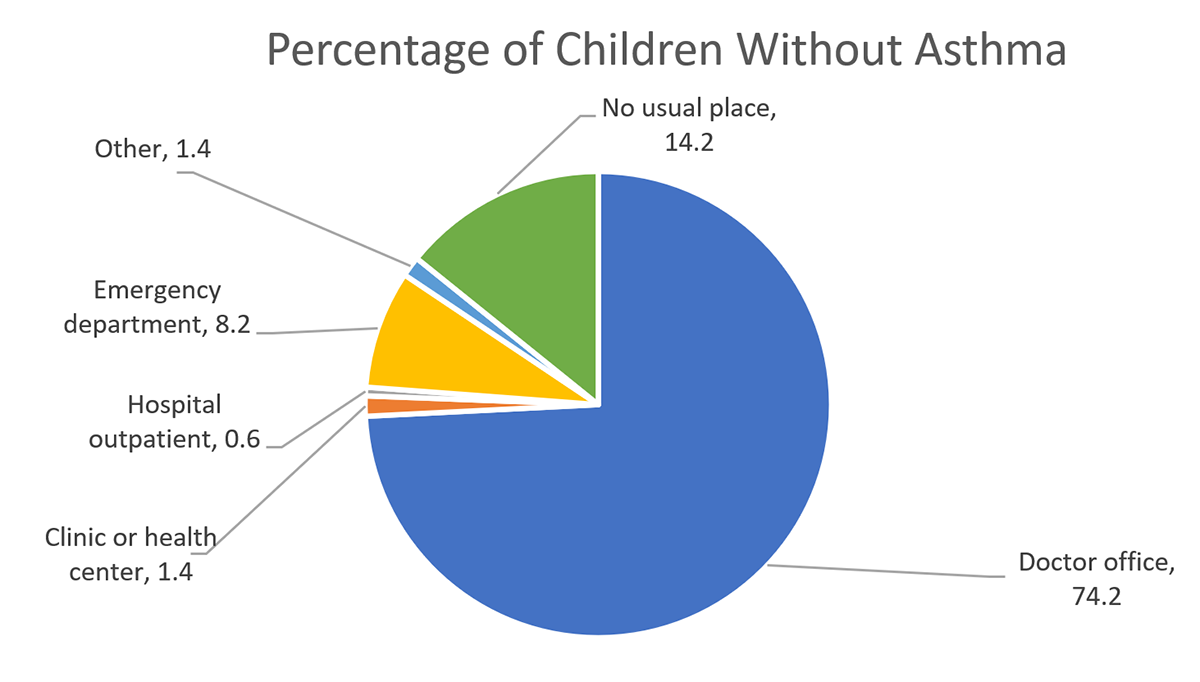
Children without asthma were more likely than children with asthma to report using the hospital emergency department as their usual place for medical care.
As stated in the Healthy People 2020’s Access to Health Services objectives, people with a usual place to go for medical care have fewer disparities and better health outcomes.*
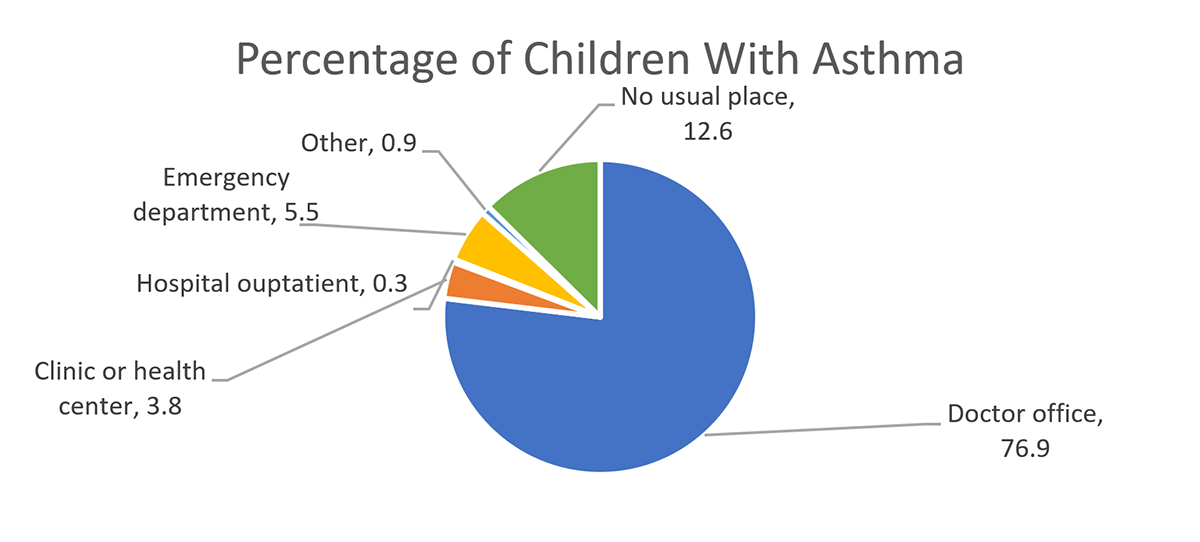
Usual Place for Medical Care: The doctor’s office was most often reported among children with asthma (76.9%) and without asthma (74.2%) for medical care. The hospital emergency department is not considered appropriate for a usual place to go for routine medical care. Fewer children with asthma (5.5%) report using the hospital emergency department as their usual place to go for medical care than children without asthma (8.2%). In addition, a greater percentage of children with asthma (3.8%) report clinics or health centers as their usual place to go for medical care than children without asthma (1.4%) (see figures and table).
Age: Across age groups, a smaller percentage children with asthma reported the emergency department as their usual place for medical care than children without asthma. A greater percentage of children with asthma age 5–11 (96.9%) reported the doctor’s office as their usual place for medical care than children without asthma (78.1%).
Sex: A higher percentage of male children with asthma reported going to a doctor’s office (78.9% vs. 75.2%), clinic, or healthcare center as a usual place to go for medical care than male children without asthma (3.4% vs. 1.1%). Male children with asthma also reported the emergency department their usual place for medical care less frequently than male children without asthma (4.4% vs. 8.2%). However, female children with asthma (4.3%) reported the emergency department as a usual place to go for medical care more frequently than female children without asthma (1.6%).
Race/Ethnicity: Non-Hispanic (NH) White children with asthma more frequently reported the doctor’s office as their usual place for medical care than NH White children without asthma (85.7% vs.82.3%). NH White children without asthma more frequently reported that they did not have a usual place to go for medical care than NH White children with asthma (9.1% vs 6.7%). Among children without asthma, NH Black children (8.9%), Hispanic children (12.5%), and NH other race (8.7%) more frequently than White children (6.1%) reported the emergency department as a usual place to go for medical care. Hispanic children without asthma more frequently than Hispanic children with asthma reported the emergency department (12.5% vs. 5.9%) as their usual place for medical care. NH other race children without asthma (16.9%) more frequently than NH other race children with asthma (7.3%) reported not having a usual place to go for medical care (see table).
CDC’s National Asthma Control Program (NACP) was created in 1999 to help the millions of people with asthma in the United States gain control over their disease. The NACP conducts national asthma surveillance and funds states to help them improve their asthma surveillance and to focus efforts and resources where they are needed.
Usual Place for Medical Care Among U.S. Children by Asthma Status, 2019–2020
| Doctor Office | Clinic Health Center | Hospital Outpatient | Emergency Department | Other† | No Usual Place | ||||||||
|---|---|---|---|---|---|---|---|---|---|---|---|---|---|
| Total | Asthma Status | % (SE) | 95% CI | % (SE) | 95% CI | % (SE) | 95% CI | % (SE) | 95% CI | % (SE) | 95% CI | % (SE) | 95% CI |
| With Asthma | 76.9 (1.30) | 74.2–79.3 | 3.8 (0.74) | 2.5–5.5 | 0.3 (0.13) | 0.1–0.7 | 5.5 (0.49) | 4.6–6.6 | 0.9 (0.15) | 0.7–1.3 | 12.6 (1.12) | 10.6–15.0 | |
| Without Asthma | 74.2 (0.46) | 73.3–75.1 | 1.4 (0.09) | 1.3–1.6 | 0.6 (0.09) | 0.5–0.8 | 8.2 (0.29) | 7.7–8.8 | 1.4 (0.09) | 1.3–1.6 | 14.2 (0.36) | 13.5–14.9 | |
| Age (years) | |||||||||||||
| 0–4 years | With Asthma | 65.6 (15.24) | 33.7–87.7 | 21.2 (14.98) | 0.2–4.5 | No data | 0 | 0.9 (0.8) | 0.2–4.5 | No data | No data | 12.3 (8.22) | 3.1–38.4 |
| Without Asthma | 78.8 (1.70) | 75.3–81.9 | 1.2 § (0.36) | 0.6–2.1 | 0.3 § (0.11) | 0.1–0.6 | 5.5 (0.82) | 4.1–7.3 | Suppr | Suppr | 13.7 (1.57) | 10.9–17.1 | |
| 5–11 years | With Asthma | 96.9 (1.42) | 92.5–98.8 | Suppr | Suppr | No data | No data | No data | No data | No data | 2.9 (1.41) | 1.1–7.4 | |
| Without Asthma | 78.1 (1.53) | 74.9–80.9 | 1.5 (0.40) | 0.9–2.5 | 0.3 § (0.13) | 0.1–0.7 | 6.8 (0.98) | 5.1–9.0 | 0.9 (0.30) | 0.4–1.7 | 12.5 (1.2) | 10.4–15.0 | |
| 12–17 years | With Asthma | 76.9 (1.30) | 62.5–86.2 | 5.2 (2.74) | 1.8–14.0 | 0.3 (0.31) | <0.0–2.2 | 4.3 (2.25) | 1.5–11.6 | No data | No data | 13.9 (5.25) | 6.4–27.6 |
| Without Asthma | 72.5 (2.06) | 68.3–76.4 | 1.6§ (0.68) | 0.7–3.6 | Suppr | Suppr | 10.1 (1.64) | 7.3–13.8 | 1.1 (0.32) | 0.6–1.9 | 14.2 (1.61) | 11.3–17.7 | |
| Sex | |||||||||||||
| Male | With Asthma | 78.9 (1.64) | 75.5–81.9 | 3.4 (0.95) | 2.0–5.8 | Suppr | Suppr | 4.4 (0.53) | 3.5–5.6 | 0.9 (0.20) | 0.6–1.4 | 12.2 (1.41) | 9.6–15.1 |
| Without Asthma | 75.2 (0.57) | 74.0–76.3 | 1.1 (0.13) | 0.9–1.4 | 0.6 (0.09) | 0.5–0.8 | 8.2 (0.29) | 7.7–8.8 | 1.4 (0.09) | 1.3–1.6 | 14.2 (0.36) | 13.0–14.8 | |
| Female | With Asthma | 74.0 (2.14) | 69.6–78.0 | 4.3 (1.18) | 2.5–7.3 | Suppr | Suppr | 7.1 (0.91) | 5.5–9.1 | 1.0 (0.22) | 0.6–1.5 | 13.4 (1.84) | 10.2–17.5 |
| Without Asthma | 73.2 (0.68) | 71.9–74.5 | 1.6 (0.22) | 1.2–2.1 | 0.7 (0.13) | 0.5–1.0 | 8.6 (0.41) | 7.9–9.5 | 1.4 (0.12) | 1.2–1.7 | 14.5 (0.55) | 13.5–15.6 | |
| Race/Ethn. | |||||||||||||
| Non-Hispanic White | With Asthma | 85.7 (1.11) | 83.4–87.8 | Suppr | Suppr | Suppr | Suppr | 5.0 (0.58) | 4.0–6.2 | 1.2 (0.24) | 0.8–1.8 | 6.7 (0.80) | 5.3–8.4 |
| Without Asthma | 82.3 (0.34) | 81.6–83.0 | 0.6 (0.09) | 0.4–0.8 | 0.4 (0.05) | 0.3–0.5 | 6.1 (0.23) | 5.6–6.5 | 1.7 (0.12) | 1.5–2.0 | 9.1 (0.25) | 8.6–9.6 | |
| Non-Hispanic Black | With Asthma | 67.2 (2.88) | 61.3–72.6 | 7.9 (1.92) | 4.9–12.6 | Suppr | Suppr | 7.4 (1.76) | 3.7–7.9 | Suppr | Suppr | 18.7 (2.37) | 14.5–23.7 |
| Without Asthma | 64.0 (1.33) | 61.3–66.5 | 4.9 (0.72) | 3.7–6.5 | 1.1 (0.27) | 0.7–1.8 | 8.9 (0.76) | 7.5–10.5 | 1.1 (0.28) | 0.4–1.8 | 20.1 (1.03) | 18.2–22.2 | |
| Hispanic | With Asthma | 68.8 (3.80) | 60.9–75.7 | 4.4 § (1.95) | 1.8–10.3 | 0.1 (0.09) | <0–0.5 | 5.9 (1.27) | 3.9–9.0 | 0.7 § (0.29) | 0.3–1.5 | 20.1 (3.54) | 14.0–27.9 |
| Without Asthma | 62.8 (1.49) | 59.8–65.7 | 1.4 (0.32) | 0.9–2.2 | 0.9 (0.31) | 0.5–1.7 | 12.5 (0.95) | 10.8–14.5 | 131 (0.20) | 0.8–1.6 | 21.2 (1.23) | 18.9–23.7 | |
| NH Other | With Asthma | 78.9 (3.43) | 71.4–84.8 | Suppr | Suppr | Suppr | Suppr | 7.4 (1.76) | 4.6–11.7 | 1.8 § (0.69) | 0.9–3.8 | 7.3 (1.72) | 4.6–11.5 |
| Without Asthma | 71.3 (1.01) | 69.2–73.2 | 0.9 (0.19) | 0.6–1.4 | 1.0 (0.23) | 0.6–1.5 | 8.7 (0.67) | 7.5–10.1 | 1.2 (0.20) | 0.8–1.6 | 16.9 (0.85) | 15.3–18.7 | |
Abbreviations: Suppr, suppressed; SE, standard error, Ethn, Ethnicity, NH, non- Hispanic; CI, confidence interval.
*https://www.healthypeople.gov/2020/topics-objectives/topic/Access-to-Health-Services
†“Other” includes retail store clinic/minute clinic, school, and survey responses of “Other.”
§RSE, 30–50%.
Suppression defined as relative standard error (RSE) >50%.
Data Source: National Survey for Children’s Health, 2019–2020 (n=72,210): questions: “Is there a place you or another caregiver usually take this child when they are sick or you need advice about their health? If yes, where does this child usually go first?”
Disclaimer: he findings and conclusions in this document have not been formally disseminated by the Centers of Disease Control and Prevention/ the Agency for Toxic Substances and Disease Registry and should not be construed to represent any agency determination or policy.