Important update: Healthcare facilities
CDC has updated select ways to operate healthcare systems effectively in response to COVID-19 vaccination.
Learn more
Find the latest information:
Recommendations for Fully Vaccinated People
COVID-19 Homepage
Recommendations for Fully Vaccinated People
COVID-19 Homepage
UPDATE
Given new evidence on the B.1.617.2 (Delta) variant, CDC has updated the guidance for fully vaccinated people. CDC recommends universal indoor masking for all teachers, staff, students, and visitors to K-12 schools, regardless of vaccination status. Children should return to full-time in-person learning in the fall with layered prevention strategies in place.
UPDATE
The White House announced that vaccines will be required for international travelers coming into the United States, with an effective date of November 8, 2021. For purposes of entry into the United States, vaccines accepted will include FDA approved or authorized and WHO Emergency Use Listing vaccines. More information is available here.
UPDATE
Travel requirements to enter the United States are changing, starting November 8, 2021. More information is available here.

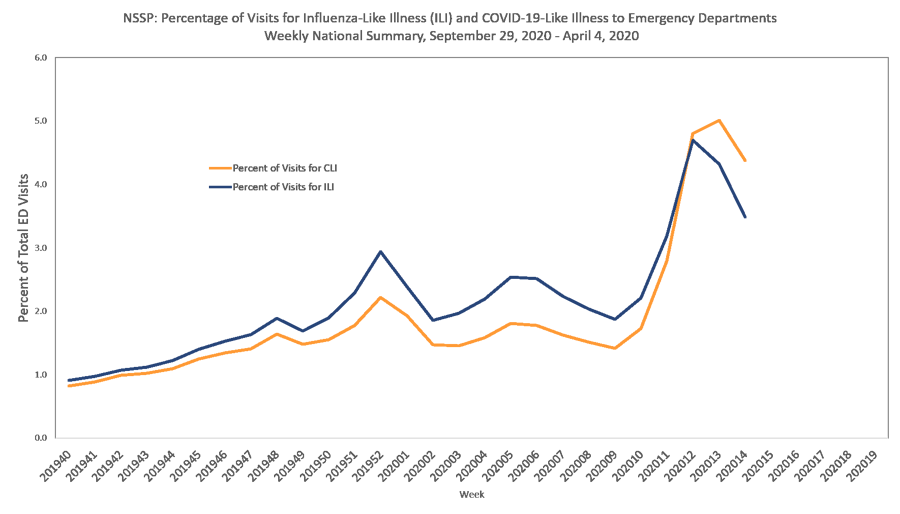
National Syndromic Surveillance Program (NSSP): Emergency Department Visits Percentage of Visits for COVID-19-Like Illness (CLI) or Influenza-like Illness (ILI) September 29, 2019 – April 4, 2020 Data as of April 9, 2020
National Syndromic Surveillance Program (NSSP): Emergency Department Visits Percentage of Visits for COVID-19-Like Illness (CLI) or Influenza-like Illness (ILI) September 29, 2019 - April 4, 2020 Data as of April 9, 2020
| National | ||||||
|---|---|---|---|---|---|---|
| Week | Number of Facilities Reporting | Total Number of ED Visits | CLI Visits | ILI Visits | ||
| Number | Percent of Total Visits | Number | Percent of Total Visits | |||
| 201940 | 3,255 | 2,146,776 | 17,639 | 0.8 | 19,503 | 0.9 |
| 201941 | 3,249 | 2,106,999 | 18,693 | 0.9 | 20,457 | 1.0 |
| 201942 | 3,256 | 2,101,358 | 20,798 | 1.0 | 22,515 | 1.1 |
| 201943 | 3,254 | 2,122,427 | 21,682 | 1.0 | 23,776 | 1.1 |
| 201944 | 3,295 | 2,087,335 | 22,936 | 1.1 | 25,466 | 1.2 |
| 201945 | 3,315 | 2,137,854 | 26,708 | 1.2 | 29,948 | 1.4 |
| 201946 | 3,328 | 2,122,363 | 28,570 | 1.3 | 32,425 | 1.5 |
| 201947 | 3,334 | 2,209,698 | 31,142 | 1.4 | 36,073 | 1.6 |
| 201948 | 3,337 | 2,097,933 | 34,353 | 1.6 | 39,613 | 1.9 |
| 201949 | 3,336 | 2,224,300 | 32,847 | 1.5 | 37,569 | 1.7 |
| 201950 | 3,342 | 2,240,477 | 34,824 | 1.6 | 42,485 | 1.9 |
| 201951 | 3,343 | 2,225,537 | 39,550 | 1.8 | 50,914 | 2.3 |
| 201952 | 3,341 | 2,332,296 | 51,679 | 2.2 | 68,616 | 2.9 |
| 202001 | 3,352 | 2,408,019 | 46,491 | 1.9 | 57,566 | 2.4 |
| 202002 | 3,355 | 2,291,586 | 33,703 | 1.5 | 42,550 | 1.9 |
| 202003 | 3,358 | 2,262,316 | 32,874 | 1.5 | 44,605 | 2.0 |
| 202004 | 3,374 | 2,259,759 | 35,862 | 1.6 | 49,574 | 2.2 |
| 202005 | 3,379 | 2,352,055 | 42,505 | 1.8 | 59,657 | 2.5 |
| 202006 | 3,382 | 2,340,858 | 41,559 | 1.8 | 58,961 | 2.5 |
| 202007 | 3,390 | 2,274,585 | 36,932 | 1.6 | 50,814 | 2.2 |
| 202008 | 3,388 | 2,256,684 | 34,182 | 1.5 | 45,846 | 2.0 |
| 202009 | 3,394 | 2,219,732 | 31,438 | 1.4 | 41,632 | 1.9 |
| 202010 | 3,403 | 2,250,329 | 38,817 | 1.7 | 49,686 | 2.2 |
| 202011 | 3,404 | 2,235,333 | 62,435 | 2.8 | 71,219 | 3.2 |
| 202012 | 3,399 | 1,794,020 | 86,088 | 4.8 | 84,208 | 4.7 |
| 202013 | 3,406 | 1,438,725 | 72,058 | 5.0 | 62,139 | 4.3 |
| 202014 | 3,397 | 1,245,869 | 54,531 | 4.4 | 43,457 | 3.5 |
| Total | 57,785,223 | 1,030,896 | 1,211,274 | |||
| Week | Number of Facilities Reporting | Total Number of ED Visits | CLI Visits | ILI Visits | ||
|---|---|---|---|---|---|---|
| Number | Percent of Total Visits | Number | Percent of Total Visits | |||
| 201941 | 202 | 130,377 | 794 | 0.6 | 814 | 0.6 |
| 201942 | 202 | 132,385 | 857 | 0.6 | 912 | 0.7 |
| 201943 | 202 | 131,866 | 875 | 0.7 | 883 | 0.7 |
| 201944 | 203 | 128,256 | 838 | 0.7 | 888 | 0.7 |
| 201945 | 203 | 127,466 | 997 | 0.8 | 979 | 0.8 |
| 201946 | 202 | 125,306 | 1,159 | 0.9 | 1,188 | 0.9 |
| 201947 | 202 | 128,877 | 1,162 | 0.9 | 1,235 | 1.0 |
| 201948 | 202 | 124,781 | 1,386 | 1.1 | 1,451 | 1.2 |
| 201949 | 202 | 125,939 | 1,328 | 1.1 | 1,362 | 1.1 |
| 201950 | 202 | 130,430 | 1,301 | 1.0 | 1,405 | 1.1 |
| 201951 | 202 | 126,317 | 1,442 | 1.1 | 1,704 | 1.3 |
| 201952 | 202 | 136,093 | 2,066 | 1.5 | 2,483 | 1.8 |
| 202001 | 202 | 144,568 | 2,131 | 1.5 | 2,567 | 1.8 |
| 202002 | 202 | 140,084 | 1,712 | 1.2 | 2,189 | 1.6 |
| 202003 | 201 | 134,746 | 1,767 | 1.3 | 2,452 | 1.8 |
| 202004 | 201 | 139,698 | 1,989 | 1.4 | 2,945 | 2.1 |
| 202005 | 201 | 146,319 | 2,376 | 1.6 | 3,496 | 2.4 |
| 202006 | 201 | 143,951 | 2,356 | 1.6 | 3,611 | 2.5 |
| 202007 | 201 | 138,226 | 1,967 | 1.4 | 2,843 | 2.1 |
| 202008 | 201 | 132,269 | 1,626 | 1.2 | 2,291 | 1.7 |
| 202009 | 201 | 133,010 | 1,441 | 1.1 | 1,912 | 1.4 |
| 202010 | 198 | 129,443 | 1,732 | 1.3 | 2,297 | 1.8 |
| 202011 | 198 | 123,621 | 2,916 | 2.4 | 3,318 | 2.7 |
| 202012 | 198 | 91,519 | 3,838 | 4.2 | 3,595 | 3.9 |
| 202013 | 198 | 74,647 | 3,193 | 4.3 | 2,560 | 3.4 |
| 202014 | 197 | 66,660 | 2,807 | 4.2 | 2,086 | 3.1 |
| Total | 3,419,098 | 46,776 | 54,215 | |||
| Week | Number of Facilities Reporting | Total Number of ED Visits | CLI Visits | ILI Visits | ||
|---|---|---|---|---|---|---|
| Number | Percent of Total Visits | Number | Percent of Total Visits | |||
| 201940 | 196 | 225,727 | 1,682 | 0.7 | 1,782 | 0.8 |
| 201941 | 196 | 221,788 | 1,658 | 0.7 | 1,787 | 0.8 |
| 201942 | 195 | 219,981 | 1,918 | 0.9 | 2,002 | 0.9 |
| 201943 | 195 | 224,672 | 1,961 | 0.9 | 2,101 | 0.9 |
| 201944 | 196 | 220,700 | 2,213 | 1.0 | 2,342 | 1.1 |
| 201945 | 195 | 218,896 | 2,472 | 1.1 | 2,642 | 1.2 |
| 201946 | 196 | 215,909 | 2,683 | 1.2 | 2,798 | 1.3 |
| 201947 | 196 | 225,655 | 2,822 | 1.3 | 3,055 | 1.4 |
| 201948 | 196 | 216,663 | 3,319 | 1.5 | 3,625 | 1.7 |
| 201949 | 196 | 224,160 | 3,397 | 1.5 | 3,706 | 1.7 |
| 201950 | 196 | 230,432 | 3,622 | 1.6 | 4,122 | 1.8 |
| 201951 | 195 | 224,906 | 4,122 | 1.8 | 4,923 | 2.2 |
| 201952 | 195 | 239,651 | 5,462 | 2.3 | 6,864 | 2.9 |
| 202001 | 195 | 250,041 | 5,453 | 2.2 | 6,739 | 2.7 |
| 202002 | 195 | 243,366 | 4,181 | 1.7 | 5,340 | 2.2 |
| 202003 | 195 | 238,487 | 4,216 | 1.8 | 5,617 | 2.4 |
| 202004 | 195 | 238,623 | 4,696 | 2.0 | 6,432 | 2.7 |
| 202005 | 195 | 245,370 | 5,189 | 2.1 | 7,050 | 2.9 |
| 202006 | 195 | 241,573 | 4,929 | 2.0 | 6,702 | 2.8 |
| 202007 | 195 | 228,893 | 3,855 | 1.7 | 5,201 | 2.3 |
| 202008 | 195 | 222,231 | 3,280 | 1.5 | 4,219 | 1.9 |
| 202009 | 195 | 222,032 | 2,940 | 1.3 | 3,696 | 1.7 |
| 202010 | 195 | 222,232 | 4,129 | 1.9 | 4,999 | 2.2 |
| 202011 | 195 | 223,489 | 8,561 | 3.8 | 9,203 | 4.1 |
| 202012 | 195 | 188,403 | 14,970 | 7.9 | 14,306 | 7.6 |
| 202013 | 195 | 166,883 | 17,922 | 10.7 | 15,264 | 9.1 |
| 202014 | 194 | 144,249 | 15,277 | 10.6 | 11,712 | 8.1 |
| Total | 5,985,012 | 136,929 | 148,229 | |||
| Week | Number of Facilities Reporting | Total Number of ED Visits | CLI Visits | ILI Visits | ||
|---|---|---|---|---|---|---|
| Number | Percent of Total Visits | Number | Percent of Total Visits | |||
| 201940 | 328 | 233,520 | 1,571 | 0.7 | 1,590 | 0.7 |
| 201941 | 328 | 231,083 | 1,630 | 0.7 | 1,619 | 0.7 |
| 201942 | 329 | 226,204 | 1,732 | 0.8 | 1,705 | 0.8 |
| 201943 | 330 | 231,324 | 1,760 | 0.8 | 1,741 | 0.8 |
| 201944 | 329 | 229,630 | 1,795 | 0.8 | 1,814 | 0.8 |
| 201945 | 330 | 224,848 | 1,987 | 0.9 | 2,000 | 0.9 |
| 201946 | 331 | 225,071 | 2,210 | 1.0 | 2,266 | 1.0 |
| 201947 | 332 | 233,791 | 2,373 | 1.0 | 2,451 | 1.0 |
| 201948 | 333 | 220,997 | 2,631 | 1.2 | 2,768 | 1.3 |
| 201949 | 332 | 233,850 | 2,541 | 1.1 | 2,787 | 1.2 |
| 201950 | 333 | 237,307 | 2,761 | 1.2 | 3,138 | 1.3 |
| 201951 | 334 | 236,476 | 3,155 | 1.3 | 3,726 | 1.6 |
| 201952 | 333 | 250,297 | 4,082 | 1.6 | 5,284 | 2.1 |
| 202001 | 333 | 263,959 | 3,934 | 1.5 | 4,649 | 1.8 |
| 202002 | 333 | 248,266 | 2,773 | 1.1 | 3,283 | 1.3 |
| 202003 | 335 | 243,035 | 2,629 | 1.1 | 3,389 | 1.4 |
| 202004 | 337 | 243,639 | 2,796 | 1.1 | 3,847 | 1.6 |
| 202005 | 338 | 253,482 | 3,337 | 1.3 | 4,675 | 1.8 |
| 202006 | 334 | 253,444 | 3,246 | 1.3 | 4,749 | 1.9 |
| 202007 | 337 | 247,384 | 3,058 | 1.2 | 4,052 | 1.6 |
| 202008 | 337 | 243,027 | 2,608 | 1.1 | 3,422 | 1.4 |
| 202009 | 337 | 240,880 | 2,597 | 1.1 | 3,440 | 1.4 |
| 202010 | 344 | 248,091 | 3,155 | 1.3 | 3,963 | 1.6 |
| 202011 | 344 | 246,795 | 5,424 | 2.2 | 6,109 | 2.5 |
| 202012 | 343 | 190,649 | 7,691 | 4.0 | 7,334 | 3.8 |
| 202013 | 343 | 151,206 | 5,830 | 3.9 | 4,834 | 3.2 |
| 202014 | 341 | 131,490 | 4,580 | 3.5 | 3,486 | 2.7 |
| Total | 6,219,745 | 83,886 | 94,121 | |||
| Week | Number of Facilities Reporting | Total Number of ED Visits | CLI Visits | ILI Visits | ||
|---|---|---|---|---|---|---|
| Number | Percent of Total Visits | Number | Percent of Total Visits | |||
| 201940 | 799 | 593,214 | 6,388 | 1.1 | 7,354 | 1.2 |
| 201941 | 802 | 582,139 | 6,732 | 1.2 | 7,732 | 1.3 |
| 201942 | 803 | 579,364 | 7,152 | 1.2 | 8,071 | 1.4 |
| 201943 | 804 | 589,121 | 7,637 | 1.3 | 8,729 | 1.5 |
| 201944 | 834 | 592,489 | 8,304 | 1.4 | 9,753 | 1.6 |
| 201945 | 836 | 601,631 | 9,629 | 1.6 | 11,276 | 1.9 |
| 201946 | 852 | 591,499 | 10,195 | 1.7 | 12,016 | 2.0 |
| 201947 | 856 | 615,297 | 11,021 | 1.8 | 13,139 | 2.1 |
| 201948 | 857 | 594,814 | 11,947 | 2.0 | 14,317 | 2.4 |
| 201949 | 859 | 628,604 | 10,629 | 1.7 | 12,650 | 2.0 |
| 201950 | 865 | 635,140 | 11,221 | 1.8 | 14,659 | 2.3 |
| 201951 | 865 | 638,407 | 13,275 | 2.1 | 18,078 | 2.8 |
| 201952 | 869 | 659,197 | 16,386 | 2.5 | 22,511 | 3.4 |
| 202001 | 868 | 676,323 | 13,562 | 2.0 | 16,739 | 2.5 |
| 202002 | 868 | 641,147 | 9,615 | 1.5 | 12,185 | 1.9 |
| 202003 | 871 | 648,754 | 9,887 | 1.5 | 13,364 | 2.1 |
| 202004 | 874 | 624,888 | 10,194 | 1.6 | 13,684 | 2.2 |
| 202005 | 877 | 659,322 | 12,366 | 1.9 | 16,987 | 2.6 |
| 202006 | 879 | 673,533 | 12,732 | 1.9 | 17,626 | 2.6 |
| 202007 | 879 | 656,042 | 10,936 | 1.7 | 14,788 | 2.3 |
| 202008 | 879 | 639,788 | 9,910 | 1.5 | 12,819 | 2.0 |
| 202009 | 881 | 623,764 | 9,136 | 1.5 | 11,759 | 1.9 |
| 202010 | 883 | 639,766 | 11,889 | 1.9 | 14,994 | 2.3 |
| 202011 | 884 | 644,417 | 18,204 | 2.8 | 20,958 | 3.3 |
| 202012 | 883 | 526,658 | 23,041 | 4.4 | 23,345 | 4.4 |
| 202013 | 883 | 417,707 | 17,200 | 4.1 | 15,655 | 3.7 |
| 202014 | 883 | 347,405 | 11,557 | 3.3 | 9,876 | 2.8 |
| Total | 16,320,430 | 310,745 | 375,064 | |||
| Week | Number of Facilities Reporting | Total Number of ED Visits | CLI Visits | ILI Visits | ||
|---|---|---|---|---|---|---|
| Number | Percent of Total Visits | Number | Percent of Total Visits | |||
| 201940 | 692 | 405,269 | 3,097 | 0.8 | 3,279 | 0.8 |
| 201941 | 687 | 394,787 | 3,366 | 0.9 | 3,492 | 0.9 |
| 201942 | 687 | 389,564 | 3,747 | 1.0 | 3,871 | 1.0 |
| 201943 | 688 | 395,249 | 3,892 | 1.0 | 4,048 | 1.0 |
| 201944 | 692 | 381,899 | 3,831 | 1.0 | 3,968 | 1.0 |
| 201945 | 698 | 388,135 | 4,165 | 1.1 | 4,277 | 1.1 |
| 201946 | 695 | 381,726 | 4,216 | 1.1 | 4,420 | 1.2 |
| 201947 | 697 | 402,287 | 4,702 | 1.2 | 4,941 | 1.2 |
| 201948 | 696 | 382,008 | 5,475 | 1.4 | 5,820 | 1.5 |
| 201949 | 697 | 414,144 | 6,015 | 1.5 | 6,376 | 1.5 |
| 201950 | 696 | 411,894 | 6,741 | 1.6 | 7,580 | 1.8 |
| 201951 | 698 | 411,759 | 7,409 | 1.8 | 9,041 | 2.2 |
| 201952 | 696 | 438,922 | 10,145 | 2.3 | 13,177 | 3.0 |
| 202001 | 696 | 450,103 | 9,290 | 2.1 | 11,400 | 2.5 |
| 202002 | 697 | 419,373 | 6,310 | 1.5 | 7,929 | 1.9 |
| 202003 | 699 | 401,105 | 5,822 | 1.5 | 8,033 | 2.0 |
| 202004 | 707 | 412,715 | 6,459 | 1.6 | 9,329 | 2.3 |
| 202005 | 707 | 433,711 | 8,084 | 1.9 | 12,308 | 2.8 |
| 202006 | 706 | 430,013 | 7,618 | 1.8 | 12,031 | 2.8 |
| 202007 | 705 | 411,120 | 6,660 | 1.6 | 10,293 | 2.5 |
| 202008 | 707 | 417,007 | 6,265 | 1.5 | 9,710 | 2.3 |
| 202009 | 708 | 408,165 | 5,753 | 1.4 | 8,706 | 2.1 |
| 202010 | 705 | 414,866 | 6,234 | 1.5 | 9,019 | 2.2 |
| 202011 | 704 | 413,023 | 10,009 | 2.4 | 12,465 | 3.0 |
| 202012 | 704 | 324,394 | 14,779 | 4.6 | 14,542 | 4.5 |
| 202013 | 704 | 256,406 | 11,654 | 4.5 | 9,688 | 3.8 |
| 202014 | 703 | 226,298 | 8,875 | 3.9 | 6,979 | 3.1 |
| Total | 10,615,942 | 180,613 | 216,722 | |||
| Total | 5,306,486 | 86,053 | 109,016 | |||
| Week | Number of Facilities Reporting | Total Number of ED Visits | CLI Visits | ILI Visits | ||
|---|---|---|---|---|---|---|
| Number | Percent of Total Visits | Number | Percent of Total Visits | |||
| 201940 | 343 | 204,621 | 1,504 | 0.7 | 1,896 | 0.9 |
| 201941 | 340 | 195,817 | 1,574 | 0.8 | 1,941 | 1.0 |
| 201942 | 341 | 197,614 | 1,927 | 1.0 | 2,274 | 1.2 |
| 201943 | 342 | 194,783 | 2,048 | 1.1 | 2,458 | 1.3 |
| 201944 | 340 | 189,526 | 2,304 | 1.2 | 2,822 | 1.5 |
| 201945 | 343 | 207,841 | 3,001 | 1.4 | 3,753 | 1.8 |
| 201946 | 344 | 205,961 | 3,306 | 1.6 | 4,104 | 2.0 |
| 201947 | 343 | 222,776 | 3,870 | 1.7 | 5,054 | 2.3 |
| 201948 | 343 | 206,915 | 3,977 | 1.9 | 4,978 | 2.4 |
| 201949 | 341 | 212,835 | 3,280 | 1.5 | 4,061 | 1.9 |
| 201950 | 341 | 209,828 | 2,970 | 1.4 | 4,035 | 1.9 |
| 201951 | 338 | 205,386 | 3,241 | 1.6 | 4,731 | 2.3 |
| 201952 | 335 | 218,846 | 4,312 | 2.0 | 6,428 | 2.9 |
| 202001 | 338 | 218,391 | 3,525 | 1.6 | 4,840 | 2.2 |
| 202002 | 339 | 204,180 | 2,564 | 1.3 | 3,541 | 1.7 |
| 202003 | 341 | 207,358 | 2,414 | 1.2 | 3,624 | 1.7 |
| 202004 | 343 | 202,629 | 2,740 | 1.4 | 4,192 | 2.1 |
| 202005 | 340 | 207,652 | 3,064 | 1.5 | 4,655 | 2.2 |
| 202006 | 342 | 201,842 | 2,988 | 1.5 | 4,449 | 2.2 |
| 202007 | 344 | 196,968 | 2,766 | 1.4 | 3,967 | 2.0 |
| 202008 | 345 | 198,547 | 2,727 | 1.4 | 3,807 | 1.9 |
| 202009 | 345 | 192,671 | 2,459 | 1.3 | 3,364 | 1.7 |
| 202010 | 345 | 200,157 | 3,011 | 1.5 | 3,965 | 2.0 |
| 202011 | 344 | 203,001 | 4,932 | 2.4 | 5,713 | 2.8 |
| 202012 | 342 | 166,065 | 6,703 | 4.0 | 6,684 | 4.0 |
| 202013 | 344 | 123,657 | 5,300 | 4.3 | 4,701 | 3.8 |
| 202014 | 344 | 110,619 | 3,546 | 3.2 | 2,979 | 2.7 |
| Week | Number of Facilities Reporting | Total Number of ED Visits | CLI Visits | ILI Visits | ||
|---|---|---|---|---|---|---|
| Number | Percent of Total Visits | Number | Percent of Total Visits | |||
| 201940 | 223 | 84,483 | 848 | 1.0 | 973 | 1.2 |
| 201941 | 224 | 80,936 | 951 | 1.2 | 1,066 | 1.3 |
| 201942 | 225 | 84,314 | 1,236 | 1.5 | 1,376 | 1.6 |
| 201943 | 224 | 83,348 | 1,279 | 1.5 | 1,387 | 1.7 |
| 201944 | 224 | 78,882 | 1,253 | 1.6 | 1,331 | 1.7 |
| 201945 | 224 | 83,297 | 1,373 | 1.6 | 1,520 | 1.8 |
| 201946 | 222 | 80,944 | 1,456 | 1.8 | 1,533 | 1.9 |
| 201947 | 224 | 86,494 | 1,695 | 2.0 | 1,853 | 2.1 |
| 201948 | 224 | 81,835 | 1,893 | 2.3 | 2,061 | 2.5 |
| 201949 | 228 | 87,836 | 1,853 | 2.1 | 1,988 | 2.3 |
| 201950 | 222 | 86,957 | 2,101 | 2.4 | 2,307 | 2.7 |
| 201951 | 226 | 83,674 | 2,393 | 2.9 | 2,691 | 3.2 |
| 201952 | 228 | 91,536 | 2,968 | 3.2 | 3,413 | 3.7 |
| 202001 | 233 | 92,006 | 2,603 | 2.8 | 2,873 | 3.1 |
| 202002 | 230 | 84,481 | 1,858 | 2.2 | 2,025 | 2.4 |
| 202003 | 231 | 82,789 | 1,730 | 2.1 | 2,054 | 2.5 |
| 202004 | 232 | 82,318 | 1,698 | 2.1 | 2,079 | 2.5 |
| 202005 | 235 | 87,555 | 2,051 | 2.3 | 2,556 | 2.9 |
| 202006 | 236 | 87,734 | 2,191 | 2.5 | 2,720 | 3.1 |
| 202007 | 236 | 87,025 | 2,358 | 2.7 | 2,876 | 3.3 |
| 202008 | 237 | 89,883 | 2,343 | 2.6 | 2,788 | 3.1 |
| 202009 | 239 | 88,796 | 2,094 | 2.4 | 2,557 | 2.9 |
| 202010 | 242 | 88,231 | 2,066 | 2.3 | 2,420 | 2.7 |
| 202011 | 246 | 85,501 | 2,600 | 3.0 | 2,837 | 3.3 |
| 202012 | 248 | 70,364 | 3,175 | 4.5 | 3,131 | 4.4 |
| 202013 | 251 | 57,734 | 2,318 | 4.0 | 2,059 | 3.6 |
| 202014 | 250 | 50,660 | 1,515 | 3.0 | 1,278 | 2.5 |
| Total | 2,229,613 | 51,899 | 57,752 | |||
| Week | Number of Facilities Reporting | Total Number of ED Visits | CLI Visits | ILI Visits | ||
|---|---|---|---|---|---|---|
| Number | Percent of Total Visits | Number | Percent of Total Visits | |||
| 201940 | 149 | 47,344 | 279 | 0.6 | 285 | 0.6 |
| 201941 | 151 | 47,012 | 329 | 0.7 | 303 | 0.6 |
| 201942 | 149 | 47,881 | 343 | 0.7 | 333 | 0.7 |
| 201943 | 148 | 46,862 | 298 | 0.6 | 340 | 0.7 |
| 201944 | 154 | 45,990 | 340 | 0.7 | 316 | 0.7 |
| 201945 | 156 | 53,751 | 487 | 0.9 | 477 | 0.9 |
| 201946 | 156 | 54,367 | 472 | 0.9 | 484 | 0.9 |
| 201947 | 153 | 55,428 | 597 | 1.1 | 630 | 1.1 |
| 201948 | 155 | 52,869 | 698 | 1.3 | 751 | 1.4 |
| 201949 | 154 | 56,500 | 573 | 1.0 | 633 | 1.1 |
| 201950 | 159 | 56,029 | 648 | 1.2 | 765 | 1.4 |
| 201951 | 157 | 56,688 | 713 | 1.3 | 918 | 1.6 |
| 201952 | 154 | 59,648 | 1,177 | 2.0 | 1,513 | 2.5 |
| 202001 | 157 | 62,670 | 1,022 | 1.6 | 1,331 | 2.1 |
| 202002 | 157 | 59,992 | 909 | 1.5 | 1,128 | 1.9 |
| 202003 | 156 | 59,172 | 854 | 1.4 | 1,152 | 1.9 |
| 202004 | 157 | 61,329 | 1,033 | 1.7 | 1,374 | 2.2 |
| 202005 | 157 | 63,028 | 1,247 | 2.0 | 1,630 | 2.6 |
| 202006 | 161 | 60,658 | 1,082 | 1.8 | 1,405 | 2.3 |
| 202007 | 161 | 60,170 | 1,010 | 1.7 | 1,345 | 2.2 |
| 202008 | 158 | 60,739 | 1,071 | 1.8 | 1,392 | 2.3 |
| 202009 | 158 | 60,219 | 994 | 1.7 | 1,264 | 2.1 |
| 202010 | 160 | 60,986 | 1,175 | 1.9 | 1,467 | 2.4 |
| 202011 | 158 | 60,560 | 2,017 | 3.3 | 2,226 | 3.7 |
| 202012 | 157 | 49,220 | 2,468 | 5.0 | 2,325 | 4.7 |
| 202013 | 158 | 41,496 | 1,900 | 4.6 | 1,614 | 3.9 |
| 202014 | 158 | 36,827 | 1,527 | 4.1 | 1,193 | 3.2 |
| Total | 1,477,435 | 25,263 | 28,594 | |||
| Week | Number of Facilities Reporting | Total Number of ED Visits | CLI Visits | ILI Visits | ||
|---|---|---|---|---|---|---|
| Number | Percent of Total Visits | Number | Percent of Total Visits | |||
| 201940 | 135 | 130,052 | 1,059 | 0.8 | 1,113 | 0.9 |
| 201941 | 135 | 132,235 | 1,166 | 0.9 | 1,211 | 0.9 |
| 201942 | 136 | 132,244 | 1,332 | 1.0 | 1,375 | 1.0 |
| 201943 | 137 | 134,291 | 1,406 | 1.0 | 1,535 | 1.1 |
| 201944 | 137 | 133,206 | 1,529 | 1.1 | 1,653 | 1.2 |
| 201945 | 141 | 143,844 | 1,931 | 1.3 | 2,304 | 1.6 |
| 201946 | 142 | 147,599 | 2,059 | 1.4 | 2,685 | 1.8 |
| 201947 | 140 | 144,915 | 2,083 | 1.4 | 2,687 | 1.9 |
| 201948 | 140 | 126,361 | 2,043 | 1.6 | 2,527 | 2.0 |
| 201949 | 139 | 143,623 | 2,234 | 1.6 | 2,697 | 1.9 |
| 201950 | 139 | 145,169 | 2,199 | 1.5 | 2,724 | 1.9 |
| 201951 | 138 | 143,670 | 2,328 | 1.6 | 2,929 | 2.0 |
| 201952 | 140 | 135,988 | 3,084 | 2.3 | 4,018 | 3.0 |
| 202001 | 138 | 147,136 | 3,225 | 2.2 | 4,028 | 2.7 |
| 202002 | 140 | 153,859 | 2,630 | 1.7 | 3,411 | 2.2 |
| 202003 | 140 | 155,262 | 2,587 | 1.7 | 3,667 | 2.4 |
| 202004 | 139 | 157,373 | 3,201 | 2.0 | 4,290 | 2.7 |
| 202005 | 139 | 159,935 | 3,555 | 2.2 | 4,646 | 2.9 |
| 202006 | 138 | 154,342 | 3,217 | 2.1 | 4,209 | 2.7 |
| 202007 | 138 | 153,368 | 3,163 | 2.1 | 4,009 | 2.6 |
| 202008 | 138 | 156,550 | 3,087 | 2.0 | 3,885 | 2.5 |
| 202009 | 139 | 153,316 | 2,638 | 1.7 | 3,259 | 2.1 |
| 202010 | 139 | 150,380 | 3,034 | 2.0 | 3,659 | 2.4 |
| 202011 | 140 | 143,220 | 4,255 | 3.0 | 4,574 | 3.2 |
| 202012 | 138 | 110,499 | 5,488 | 5.0 | 5,096 | 4.6 |
| 202013 | 138 | 86,732 | 4,041 | 4.7 | 3,367 | 3.9 |
| 202014 | 138 | 76,153 | 3,133 | 4.1 | 2,482 | 3.3 |
| Total | 3,751,322 | 71,707 | 84,040 | |||
| Week | Number of Facilities Reporting | Total Number of ED Visits | CLI Visits | ILI Visits | ||
|---|---|---|---|---|---|---|
| Number | Percent of Total Visits | Number | Percent of Total Visits | |||
| 201940 | 187 | 90,302 | 491 | 0.5 | 482 | 0.5 |
| 201941 | 184 | 90,825 | 493 | 0.5 | 492 | 0.5 |
| 201942 | 189 | 91,807 | 554 | 0.6 | 596 | 0.6 |
| 201943 | 184 | 90,911 | 526 | 0.6 | 554 | 0.6 |
| 201944 | 186 | 86,757 | 529 | 0.6 | 579 | 0.7 |
| 201945 | 189 | 88,145 | 666 | 0.8 | 720 | 0.8 |
| 201946 | 188 | 93,981 | 814 | 0.9 | 931 | 1.0 |
| 201947 | 191 | 94,178 | 817 | 0.9 | 1,028 | 1.1 |
| 201948 | 191 | 90,690 | 984 | 1.1 | 1,315 | 1.4 |
| 201949 | 188 | 96,809 | 997 | 1.0 | 1,309 | 1.4 |
| 201950 | 189 | 97,291 | 1,260 | 1.3 | 1,750 | 1.8 |
| 201951 | 190 | 98,254 | 1,472 | 1.5 | 2,173 | 2.2 |
| 201952 | 189 | 102,118 | 1,997 | 2.0 | 2,925 | 2.9 |
| 202001 | 192 | 102,822 | 1,746 | 1.7 | 2,400 | 2.3 |
| 202002 | 194 | 96,838 | 1,151 | 1.2 | 1,519 | 1.6 |
| 202003 | 189 | 91,608 | 968 | 1.1 | 1,253 | 1.4 |
| 202004 | 189 | 96,547 | 1,056 | 1.1 | 1,402 | 1.5 |
| 202005 | 190 | 95,681 | 1,236 | 1.3 | 1,654 | 1.7 |
| 202006 | 190 | 93,768 | 1,200 | 1.3 | 1,459 | 1.6 |
| 202007 | 194 | 95,389 | 1,159 | 1.2 | 1,440 | 1.5 |
| 202008 | 191 | 96,643 | 1,265 | 1.3 | 1,513 | 1.6 |
| 202009 | 191 | 96,879 | 1,386 | 1.4 | 1,675 | 1.7 |
| 202010 | 192 | 96,177 | 2,392 | 2.5 | 2,903 | 3.0 |
| 202011 | 191 | 91,706 | 3,517 | 3.8 | 3,816 | 4.2 |
| 202012 | 191 | 76,249 | 3,935 | 5.2 | 3,850 | 5.0 |
| 202013 | 192 | 62,257 | 2,700 | 4.3 | 2,397 | 3.9 |
| 202014 | 189 | 55,508 | 1,714 | 3.1 | 1,386 | 2.5 |
| Total | 2,460,140 | 37,025 | 43,521 | |||